There’s no shortage of opinions about the Net Promoter Score.
There’s nothing wrong with an opinion. It’s just better when there’s data backing it.
Unfortunately, when it comes to opinions about the Net Promoter Score, especially how the underlying question is displayed, the opinions are often based on anecdotes and out-of-context “best practices.”
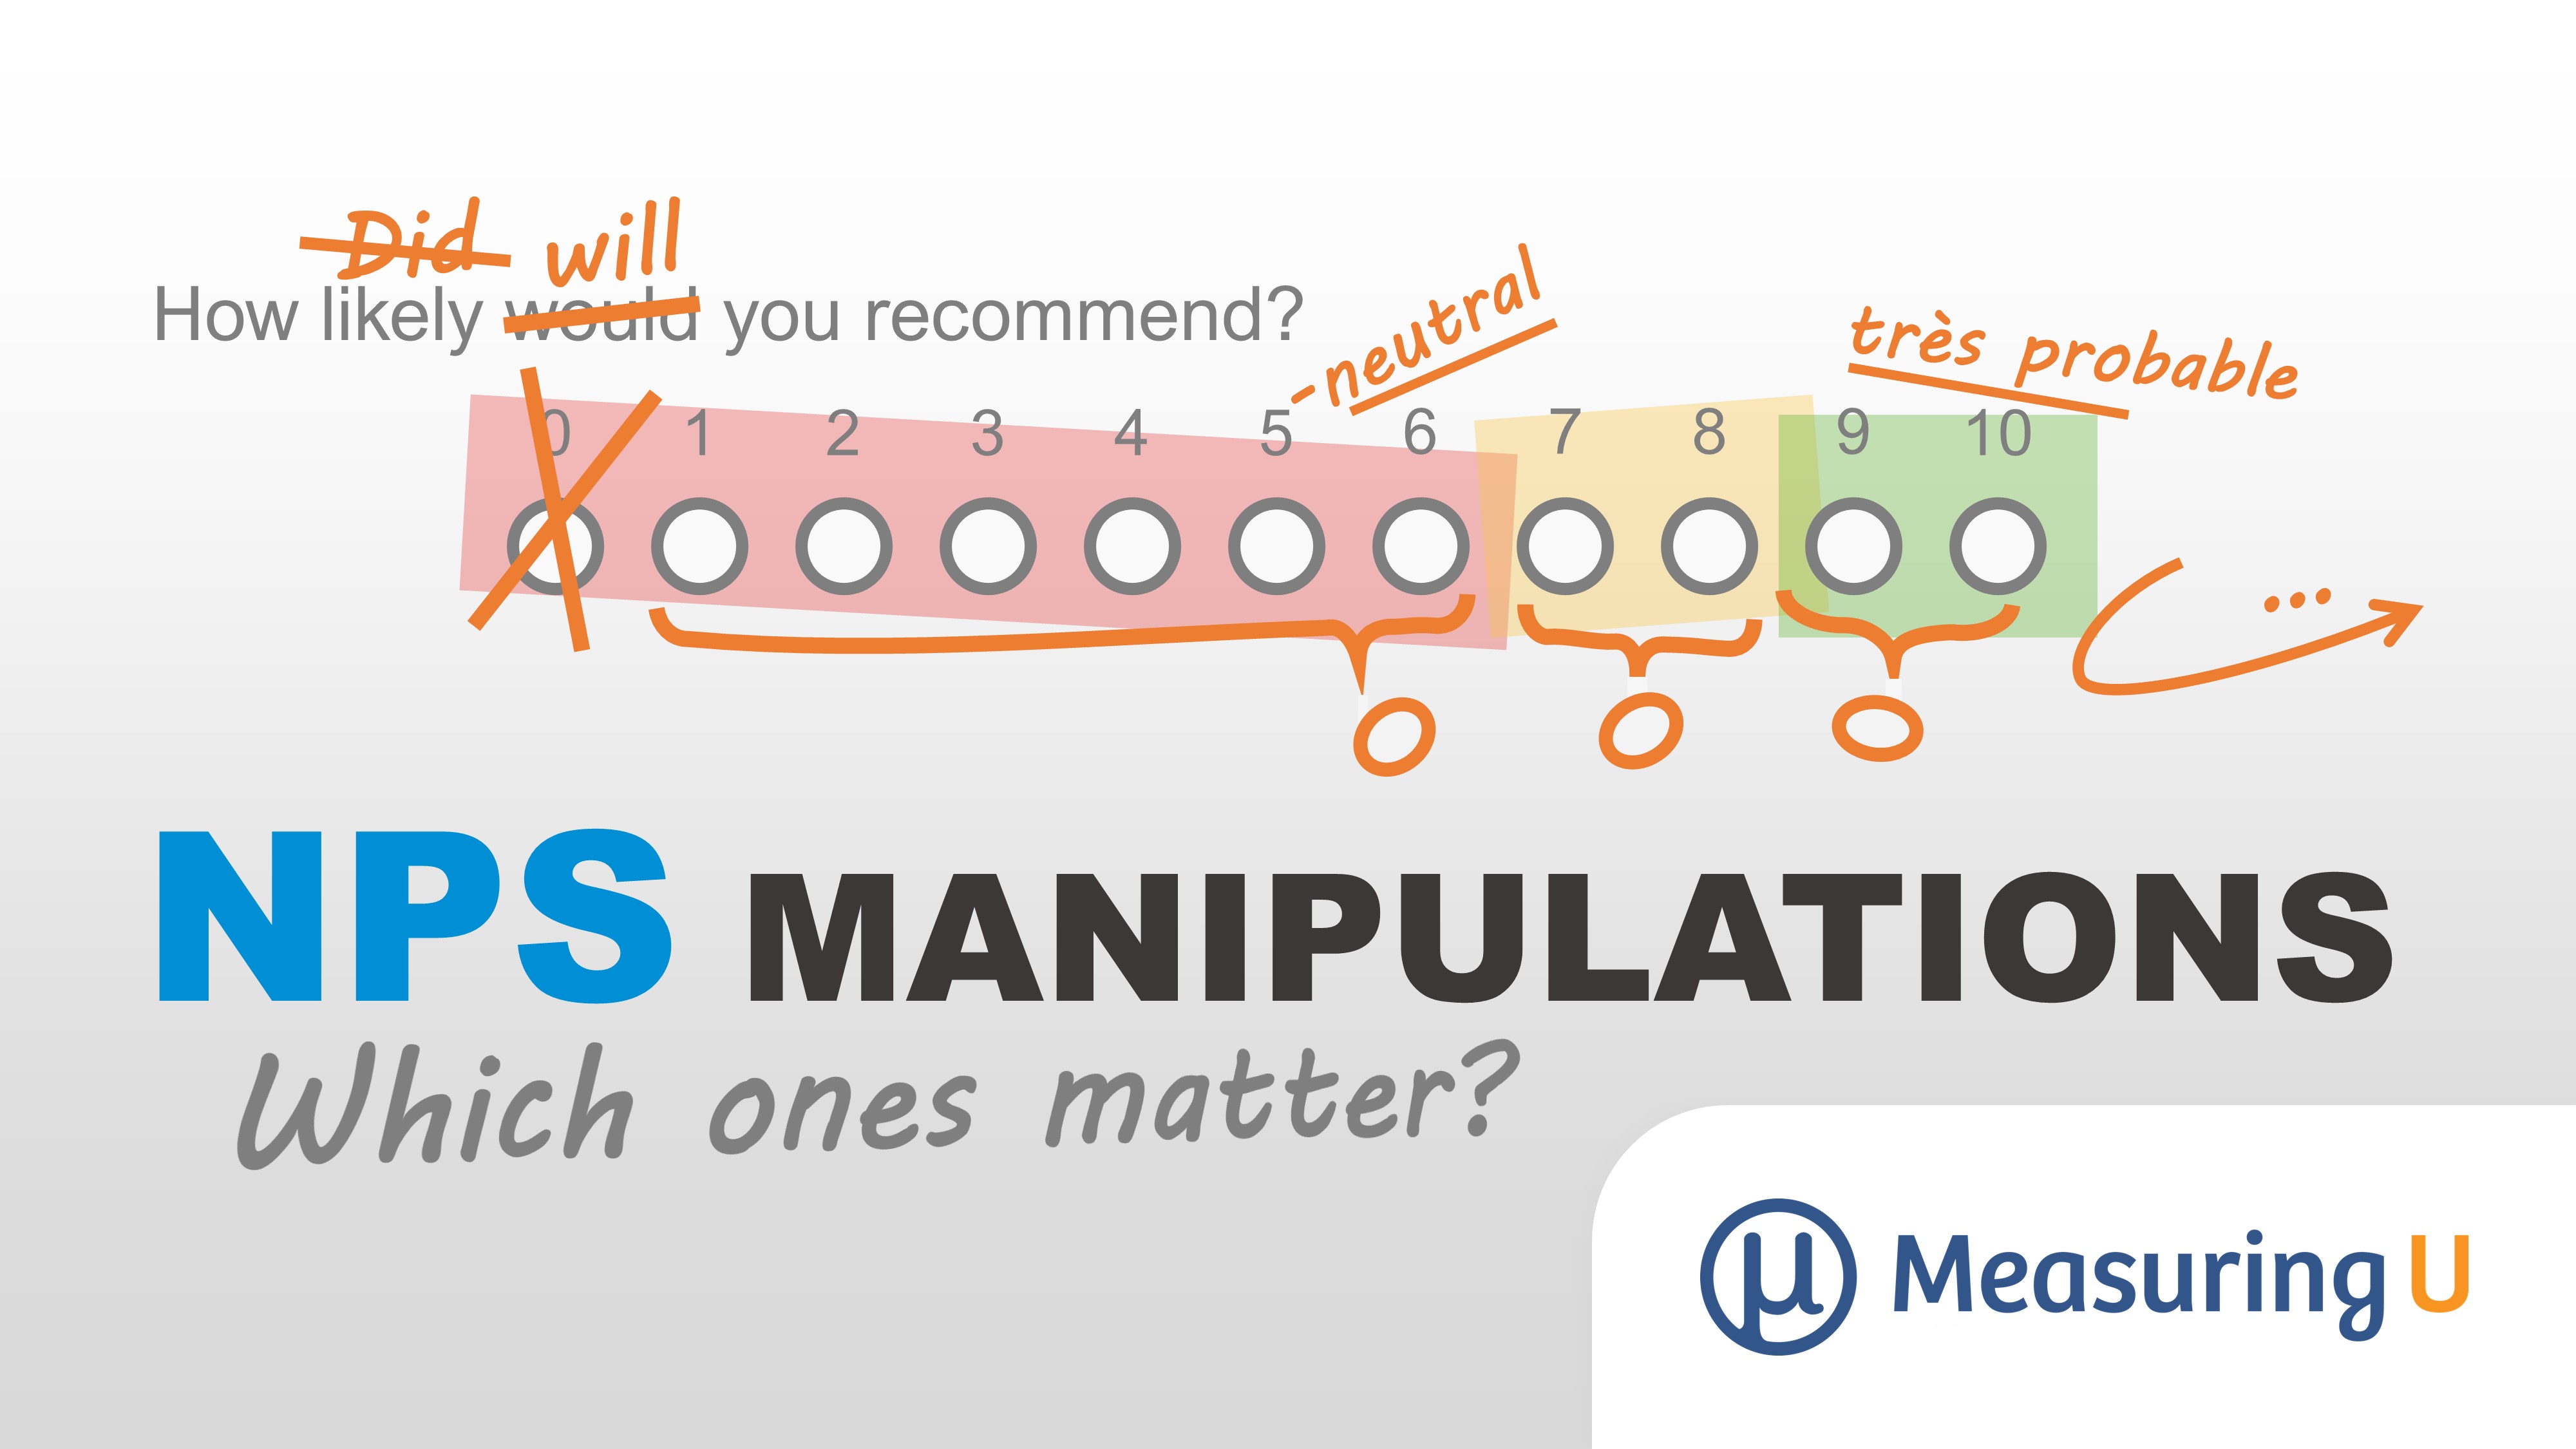
At MeasuringU, we want to help others use data to form better opinions. Consequently, we conducted 15 studies and presented eight articles over the last few years that examined very specific variations on how to phrase the Likelihood to Recommend question and how to present the response options. Here is a summary of those findings.
- Does adding color to the scale affect responses?
To break up longer multi-point scales, some survey designers employ colors, such as in the example below. What effect does this have on responses? Across two studies with 413 participants, we found surprisingly little effect when we manipulated the color of the eleven-point response scale. The differences in scores when the colors were present compared to an uncolored version were between 1% and 2%. The largest differences were observed when aggregating across people and brands, but even then, the differences were still modest at around 3%.

- What effects does a neutral label have?
What are the effects of having a neutral label on the eleven-point Likelihood to Recommend (LTR) item used to compute the NPS? Across two studies examining the effects of labeling the neutral midpoint of the LTR item, we found having a neutral label sometimes attracts responses (but not always).
For a combined group of customers and non-customers, adding a neutral label had only a small effect (.43 or 4% increase in mean scores). The effect was only .04 and wasn’t statistically significant when measuring only customers. When it did have an effect, the neutral point label appeared to attract other detractor responses from the 0 to 4 range with non-customers only. Note that movement within detractor responses would have no effect on the derived NPS.

Distribution for responses for only the most frequently used software products.
- Can you use a five- or ten-point scale instead of an eleven-point scale?
While the original Likelihood to Recommend item presented by Fred Reichheld in 2003 was based on an eleven-point (0 to 10) scale, over the years we’ve seen organizations also use five- and ten-point response options. How does changing the response options to five or ten points differ from using eleven points?
We conducted a study with 520 U.S.-based participants across nine brands (airlines, entertainment/media, and satellite providers), with approximately 50 responses per brand. The participants answered three variations of the Likelihood to Recommend item (five, ten, and eleven points) in a within-subjects study.
We found changing the NPS scale points only affected the scores a little (between 2% and 4%). The average absolute difference by brand was 4 points on the 200-point NPS (-100 to 100). The largest difference was 14 points (Delta Airlines). For the most part, regardless of the scale used (five, ten, or eleven), the Net Promoter Score was in a similar range. For example, Netflix consistently had a high score (in the 60s), Facebook had an average score (20s to 30s), and Comcast had a very low score (-50s to -60s).
| Label | No Label | Diff (Label - No Label) | |
|---|---|---|---|
| Netflix | -51% | -46% | 6% |
| United | -26% | -26% | 0% |
| Southwest | -64% | -57% | 7% |
| 10% | 10% | 0% | |
| Delta | -73% | -66% | 7% |
| Microsoft | -29% | -28% | 1% |
| Target | -69% | -75% | -6% |
| Whole Foods | -48% | -54% | -7% |
| 7 Eleven | -66% | -56% | 10% |
- Why not just use a three-point scale?
Because the eleven-point Likelihood to Recommend item gets converted into a three-point scale (promoters, detractors, and passives), some have wondered why not just use a three-point scale? Building on earlier research that shows three-point scales tend to stifle respondents because they offer too few response options (and don’t allow for identifying extreme responders), we conducted three studies to measure the impact specifically on the NPS.
We found Net Promoter Scores derived from three-point scales differ substantially from those derived from eleven-point scales. Using the aggregated data to create Net Promoter Scores across multiple brands resulted in both different and much higher net scores. In two surveys, the three-point NPS and eleven-point NPS differed by 17 points in Study 1, 26 points in Study 2, and 54 points in Study 3. This was substantially larger than the differences observed between five- and ten-point scales. When asked, respondents rated the three-point scale as quicker to complete but rated the eleven-point scale as better allowing them to express their feelings adequately. We, however, found no statistical difference in the time it took participants to respond to both three-point and eleven-point scales.
Our analysis shows a lot of ambiguity in the simple labels of “yes,” “no,” and “maybe.” One person’s “Yes” might be better read as “YES!” compared to another person’s more tepid “Yes, I guess.” In contrast, 10 is greater than 9, which is greater than 8 and these quantities are universally understood as being greater. Providing eleven response options on this scale better reflects the underlying attitude continuum that is only coarsely measured with three-point scales. The distribution of responses shows, for example, that on the eleven-point scale roughly half of the yeses selected 10 (YES!!!), 75% selected 9 or 10 (YES!), but 25% selected less intense responses (Yes, I guess).

Our recommendation is not to use a three-point scale when measuring behavioral intentions. While converting the eleven-point scale to three points loses information, the loss isn’t permanent as you can still examine the distribution of responses and, if you wish, track the mean Likelihood to Recommend along with the NPS. However, if you start with a three-point question you give up any ability to capture the intensity of response needed to accurately map to standard Net Promoter Scores.
- Do responses differ if you ask “will” versus “would” recommend?
There is a subtle difference in meaning between “will” (which implies a definite future action) compared to ”would” (which implies a potential future action, or even something that was in the future but isn’t anymore). Does this subtle change in wording affect the Likelihood to Recommend item and Net Promoter Scores?
We conducted two studies with 533 participants to find whether there was a difference. We found using “will recommend” instead of “would recommend” had a small, statistically significant increase of 1.5% for only one brand (Target) in one of our studies. Across all brands, the average mean difference was less than 1% higher for the “will” condition.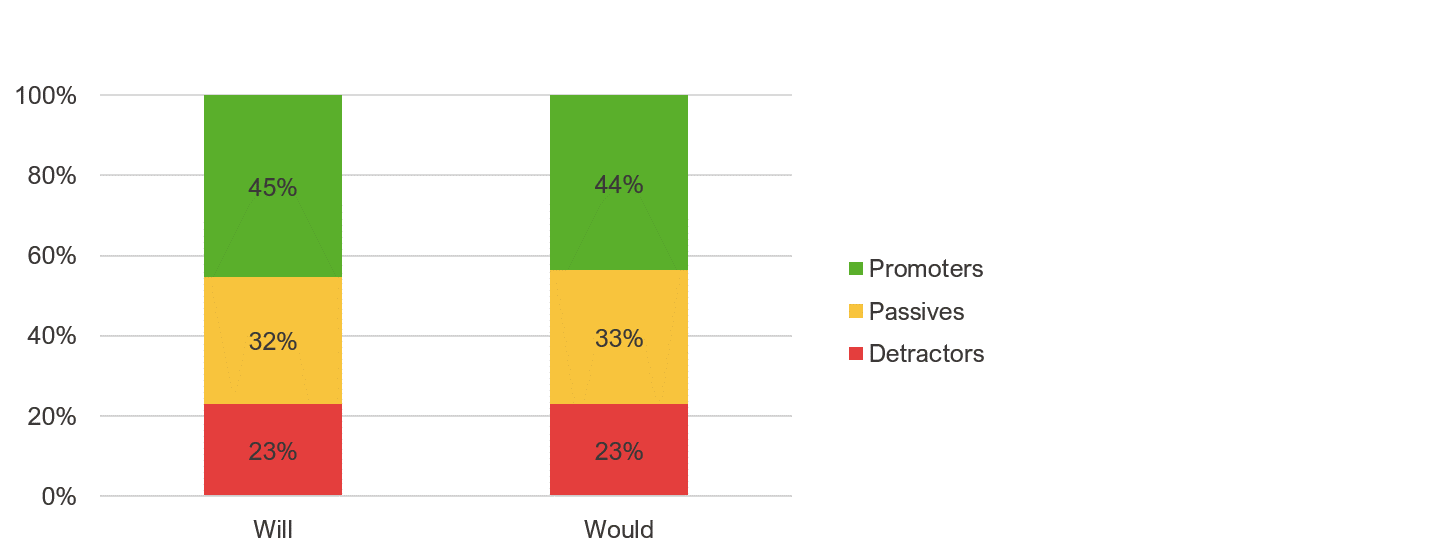
We had suspected using the word “will” may imply a more definite future action to respondents and reduce scores, as in “I definitely WILL do something,” compared to the less definite “I would do something.” We, therefore, expected the mean scores for “will” to be slightly lower (as people might hedge their intentions). However, the results show the opposite, as the means were nominally higher for the “will” groups (again, slightly and statistically significant in only one case).
- How does culture/country affect Likelihood to Recommend responses?
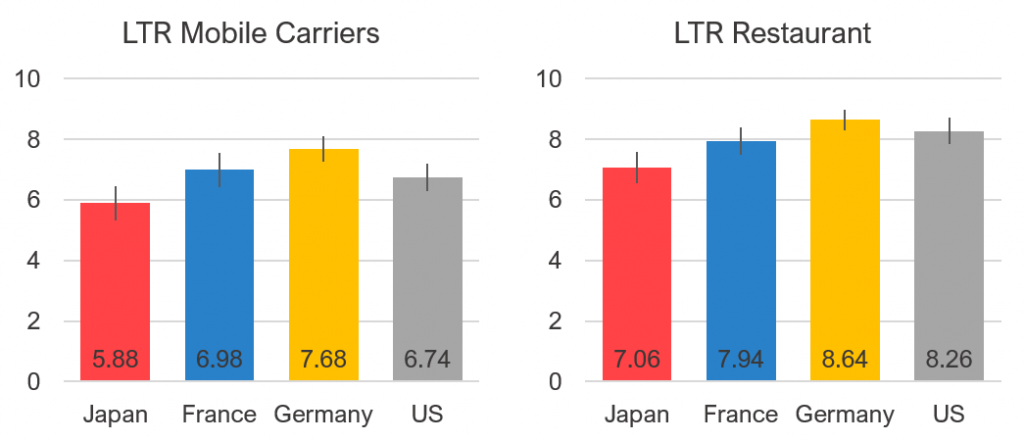
In this study, we examined how response patterns on the Likelihood to Recommend item might differ in the United States, France, Germany, and Japan. We asked participants how likely they would be to recommend their mobile carrier and their most recently visited restaurant (hoping they were similar cultural experiences). We found the largest differences were that U.S. participants were twice as likely as Japanese participants to select the most extreme response. Conversely, Japanese participants were around twice as likely to select the neutral option. These results were consistent with other published research that found extreme response aversion from Asian cultures compared to Western cultures. This suggests cultural/regional differences (at least between Eastern and Western countries) may confound any cross-country comparisons when using the NPS (and rating scales in general).
- Does changing when the NPS item is displayed affect results?
There is a well-documented order effect in surveys. That is, the order in which questions or items are presented in a survey can affect how people respond. However, order effects are difficult to predict and replicate.
For the Net Promoter Score, there is at least one report that shows that if you ask the “would recommend” question early in a survey, the score will be higher than if you ask it later in the survey, but no data is given on the size of the effect.
We conducted two studies with 3,175 participants and manipulated when the Likelihood to Recommend item appeared (earlier or later in the survey). We found little effects of order in our studies.
The LTR means (and the distribution of scores) were virtually identical whether the question was placed earlier or later in the survey in both studies involving different websites and a mix of companies and products. We did find slightly higher explanatory power when the LTR was placed before the other seven SUPR-Q items, but a future study is needed to replicate these findings.
- Is “Did You Recommend” better than “Would You Recommend”?
Asking people to predict their future behavior is frowned upon by many researchers, based on beliefs that (1) people aren’t good at predicting future behavior and (2) people are better at reporting past behavior, making reports of past behavior better predictors of future behavior.
In a meta-analysis of 16 studies, Ouellette and Wood (1998) found that past behavior correlated with future behavior, but the correlation was generally modest (r = .39). Interestingly, though, they found behavioral intentions (how likely you are to do something) were better predictors of future behavior (r = .54). We also conducted two studies to examine how past recommendations differed from recommend intentions via the eleven-point LTR item. We found that both measures offer comparable results.
Across the two studies, around 92% of respondents who did recommend were also most likely to recommend again (if you include the promoters and passives category). The main reason we found why people who had recommended won’t in the future is that they (or the person they recommended) had a disappointing experience. This can happen from participants who had a more recent bad experience or because the product or service changed (as was the case when Netflix changed its pricing).
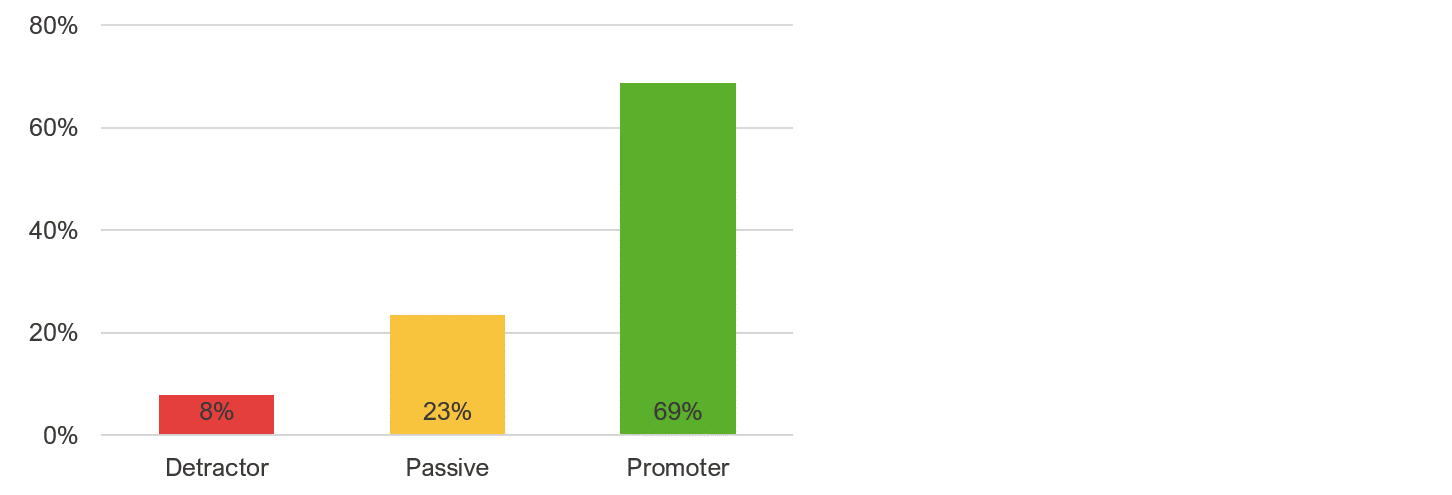
Percent of respondents who are promoters, passives, and detractors for products or services they reported recommending in the past (n = 2672).
If you’re able, ask about both the past and future. It’s likely that people who recommended and are extremely likely to recommend again are the best predictors of who will recommend in the future. (Something we’re exploring more in an upcoming study!)
Summary
To examine the effects of manipulations of the Likelihood to Recommend (LTR) item, from which Net Promoter Scores (NPS) are derived, we used data from 15 of our own studies to examine the effects. Overall, we found negligible effects for most manipulations, with the exception of a three-point scale and cultural regional differences. This is summarized in the table below.
| Manipulation | # of Studies | Sample Size | Effect Size | Average Effect Found | Note |
|---|---|---|---|---|---|
| Adding Color | 2 | 413 | Small | 2% | Surprisingly Small Effect |
| Neutral Label | 2 | 2704 | Small | 2% | Mostly Affects Non-Customers |
| 5 or 10 Points | 1 | 520 | Small | 3% | Small Effect, Stay Consistent |
| 3-Point Scale* | 3 | 1737 | Large | 16% | Don't Use 3-Point Scales |
| Will vs Would Recommend | 2 | 533 | Small | 1% | Effect Was Barely Detectible |
| Cultural Effects* | 1 | 215 | Large | 13% | Japan vs US had biggest difference |
| Display Order | 2 | 3175 | None | 0% | No Effect Found |
| Did vs Would Recommend | 2 | 4672 | Small | 8% | Future Intent Often Better, Use Both |
* This manipulation matters.