 When trying to measure something abstract and multi-faceted like “User Experience,” you should be open to considering and assessing different measurement approaches.
Some are popular and others are obscure. At MeasuringU, we’ve found that even when we don’t necessarily recommend a measure or method, we can often adapt aspects of it and apply them to other measures.
The Subjective Mental Effort Questionnaire (SMEQ) is one of those lesser-known scales. It is used to assess perceived mental effort—a construct similar to user experience. It was originally developed in Dutch in the 1990s but hasn’t been used much.
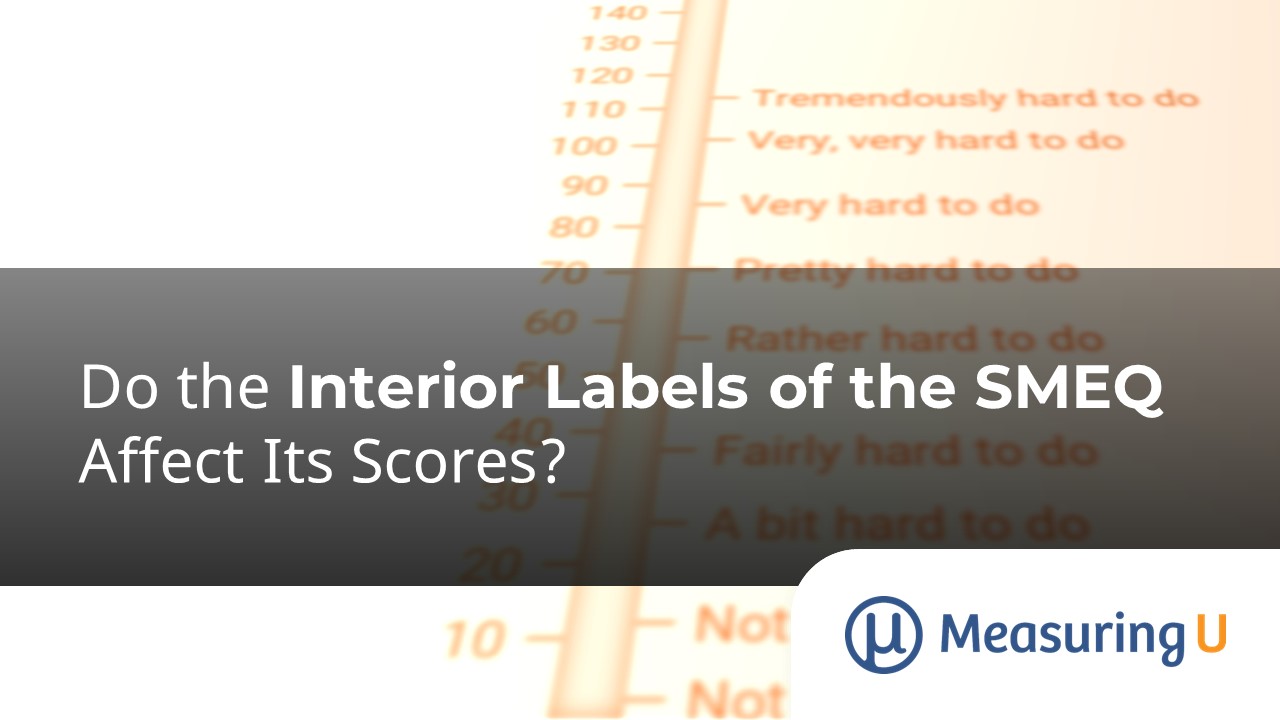
As shown in Figure 1, the SMEQ has three unusual characteristics: (1) its response options range from 0 to 150; (2) nine of the interior points (but neither endpoint) are labeled; (3) the intervals between labels are unequal. These scale design decisions were driven by the research conducted to develop the SMEQ and are, therefore, not arbitrary.
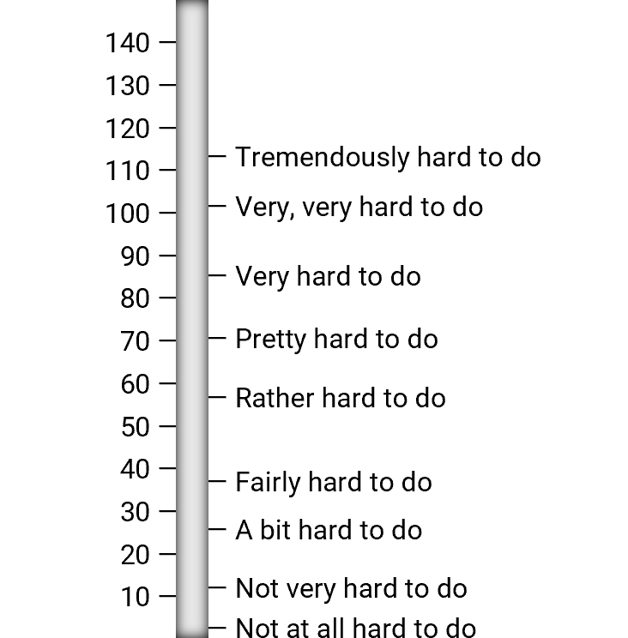
Figure 1: The standard SMEQ (with interior labels).
Researchers are often concerned about the extent to which labels affect the measurement properties of scales, especially the difference between labeling multiple points versus just the endpoints (Figure 2).
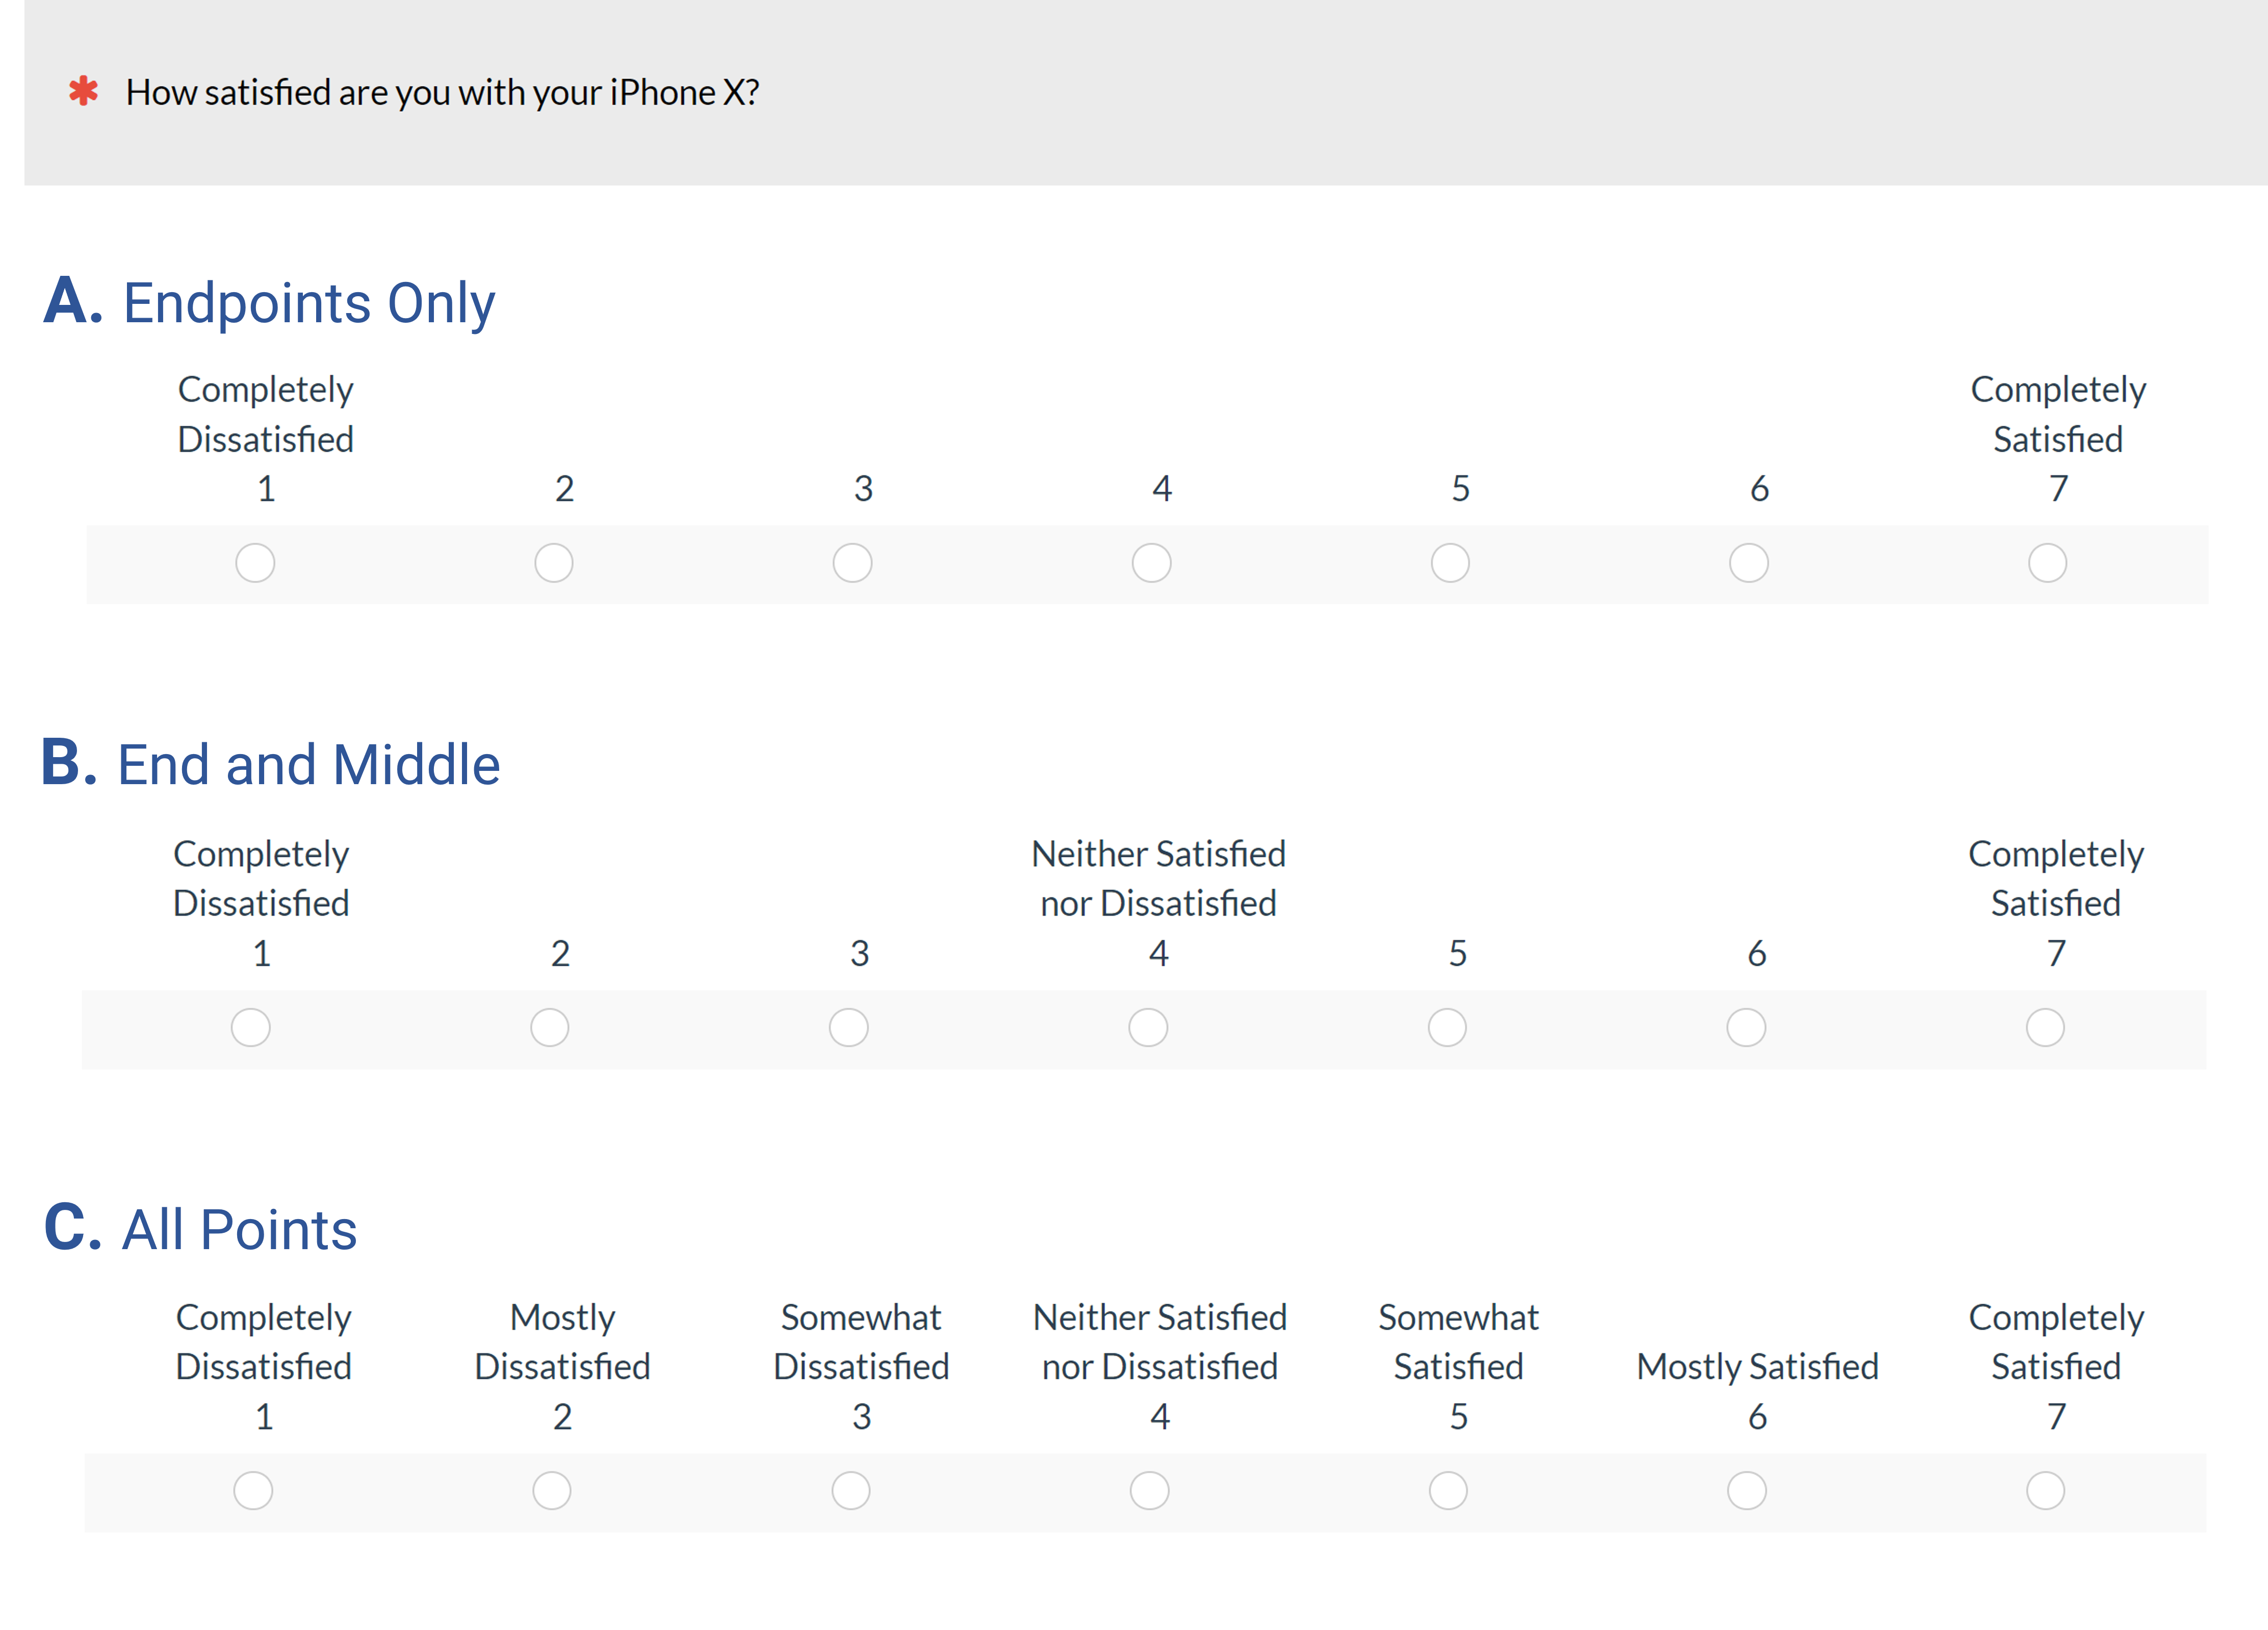
Figure 2: Rating scales with labeling on endpoints only (A), end and middle points (B), and all points (C).
There are different ways labels might affect rating behaviors, either attracting or repelling responses. For example, labeling the middle response could make it more likely for someone who might otherwise select 3 to select 4—or maybe pull a potential selection of 5 down to 4. Or maybe the label pushes responses away, leading someone who would have selected 4 to either select 3 or 5. Another possibility is that people taking surveys don’t pay that much attention to those kinds of formatting details, so the presence or absence of the label doesn’t matter.
When we ran an experiment comparing the items in Figure 2, we found no significant differences in means (A: 6.09, B: 6.13, C: 6.11) or top-box percentages (A: 41%, B: 42%, C: 40%). In the same experiment, we did find some statistically significant (but not practically significant) differences with five-point versions of the items. Overall, we estimate the effect size of this type of labeling manipulation to be less than half a percent.
But what about the effects of labeling on a more complex item like the SMEQ?
Given the care with which the interior SMEQ labels (those between “Not at all hard to do” and “Tremendously hard to do”) were placed, we were curious about whether they had more effect on resulting measurements than the interior labels assigned to scales like those shown in Figure 2. We collected some data to find out.
Study Details
As part of a larger experiment designed to compare different versions of standard rating scales, we used our MUIQ® platform to collect data from 211 participants (sampled from a US panel provider in two surveys, 103 in February 2023 and 108 in March 2023). Participants completed five exercises that were a mix of retrospective and task-based activities with varying difficulty, presented in random order (Table 1).
| Task Code | Type | Description |
|---|---|---|
| XFI | Task-based | Imagine you are helping your friend troubleshoot a problem with their cable TV and internet service. Find the Xfinity customer service phone number to call for support. |
| ATT | Task-based | You will be asked to find the monthly cost of an iPhone 14 with a specific plan on the AT&T website. Copy or remember the monthly cost (including all fees. |
| TAX | Retrospective | Reflect on the last time you filed your taxes. |
| SHA | Task-based | One of the numbered figures in the drawing below is more different than the others. What is the number in that figure?" (Note: The fourth figure had six sides while all the others had four.) |
| AMA | Retrospective | Please reflect on your most recent purchase from Amazon.com. |
After each task, respondents provided three ratings of perceived ease: a click version of the SMEQ (respondents selected their response options by clicking an image of the item), the standard Single Ease Question (SEQ®), and a new adjective scale for task ease/difficulty. These items were presented in random order on a task-by-task basis.
We wrote about the relationship between the SEQ and the adjective scale in an earlier article. As described in the introduction, the focus of this article is the comparison of the measurement properties of two versions of the SMEQ, with and without its interior labels. In the February 2023 survey, respondents rated their task experiences with the standard version (Figure 1). In the March 2023 survey, respondents rated experiences with an alternate version in which all interior labels had been removed (Figure 3).
Figure 3: The SMEQ without its interior labels.
Study Results
Using the click-testing capability of MUIQ, we obtained two metrics from these SMEQ images. From analysis of the coordinates of the clicked locations on the image, we assigned a number from 0 to 150 (the range of the SMEQ scale). We also defined image hotspots around the locations of the SMEQ labels (regardless of whether those labels were visible to respondents) and, as shown in Figure 4, assigned numbers from 1 (“Not at all hard to do”) to 9 (“Tremendously hard to do”).
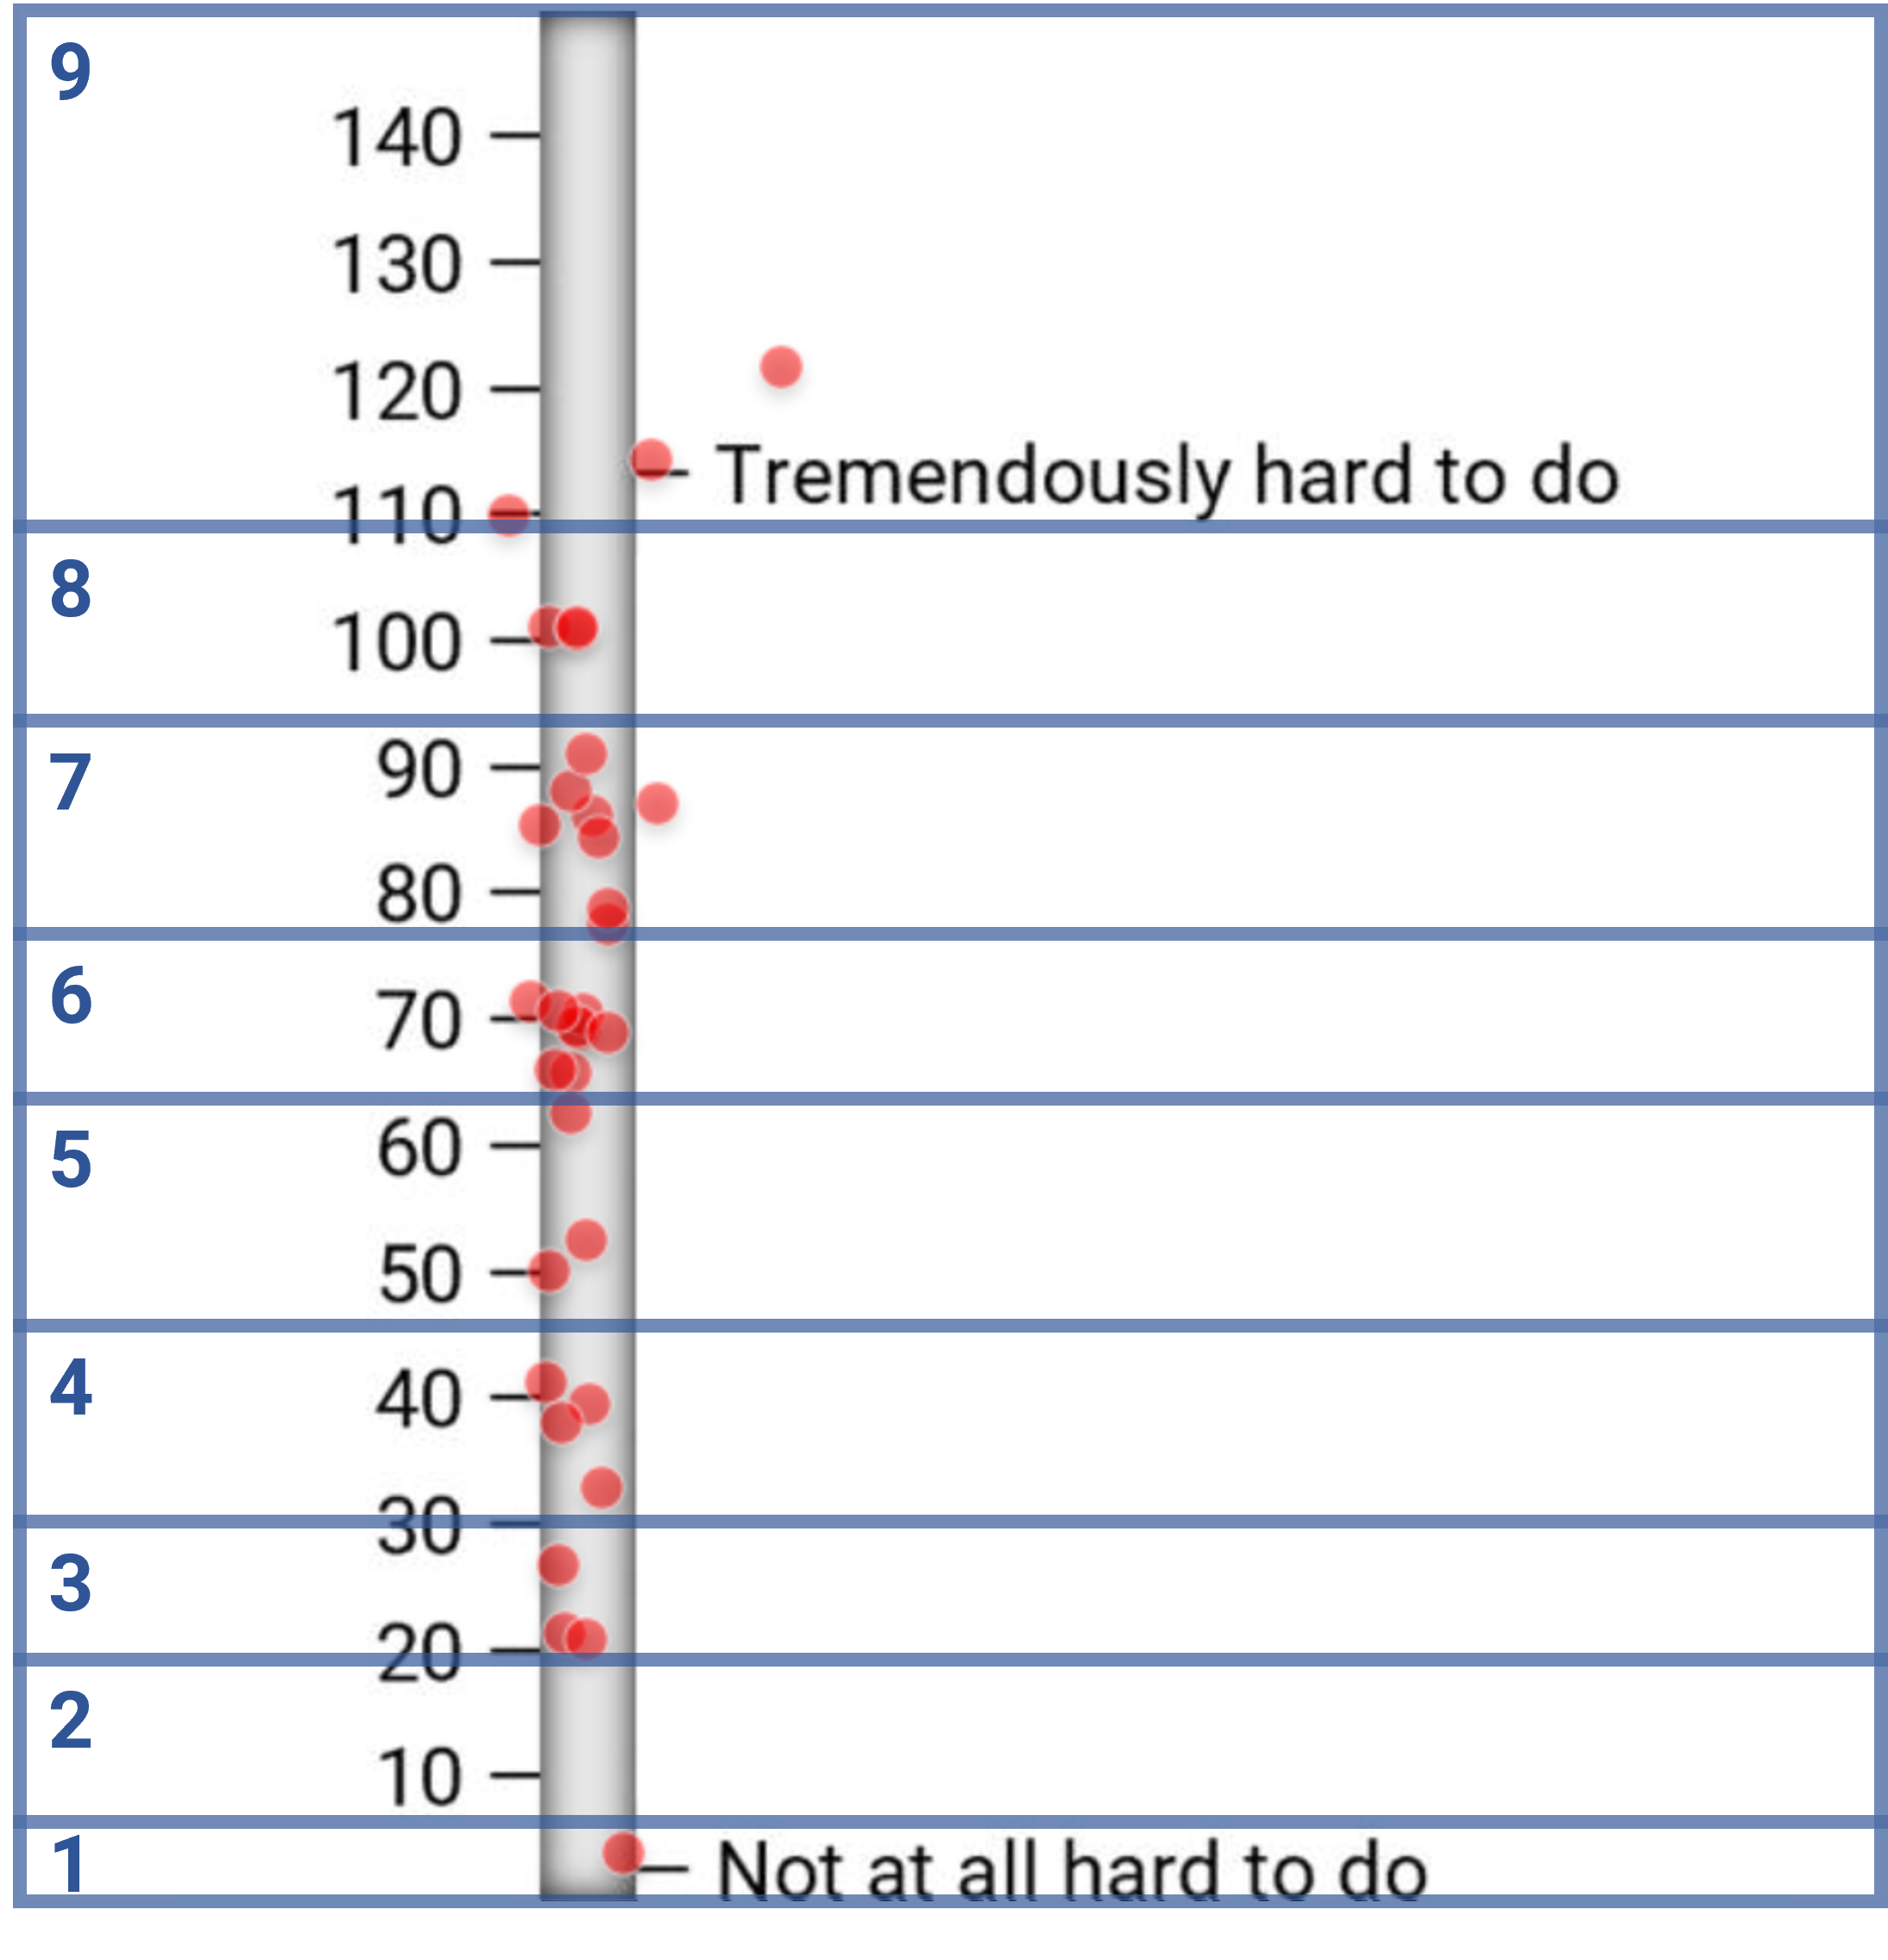
Figure 4: Assignment of numbers to SMEQ label regions (image hotspots were the same with or without interior labels). Dots show clicks of participants (shown here for the ATT task as an example).
SMEQ Scale Means
As shown in Figure 5, there was no overlap between 95% confidence intervals for standard and alternate formats for any of the five tasks. A mixed ANOVA with task as a within-subjects independent variable and SMEQ format as a between-subjects independent variable found both main effects and their interaction to be statistically significant. The differences among the tasks had the strongest effect (F(4, 836) = 316.0, p < .0001, partial η2 = .60). The main effect of SMEQ format was the second strongest (F(1, 209) = 57.6, p < .0001, partial η2 = .22, overall difference: 14.9, which is about 10% of the scale range). The interaction between task and format, though significant, was relatively weak (F(4, 836) = 2.6, p = .035, partial η2 = .01).
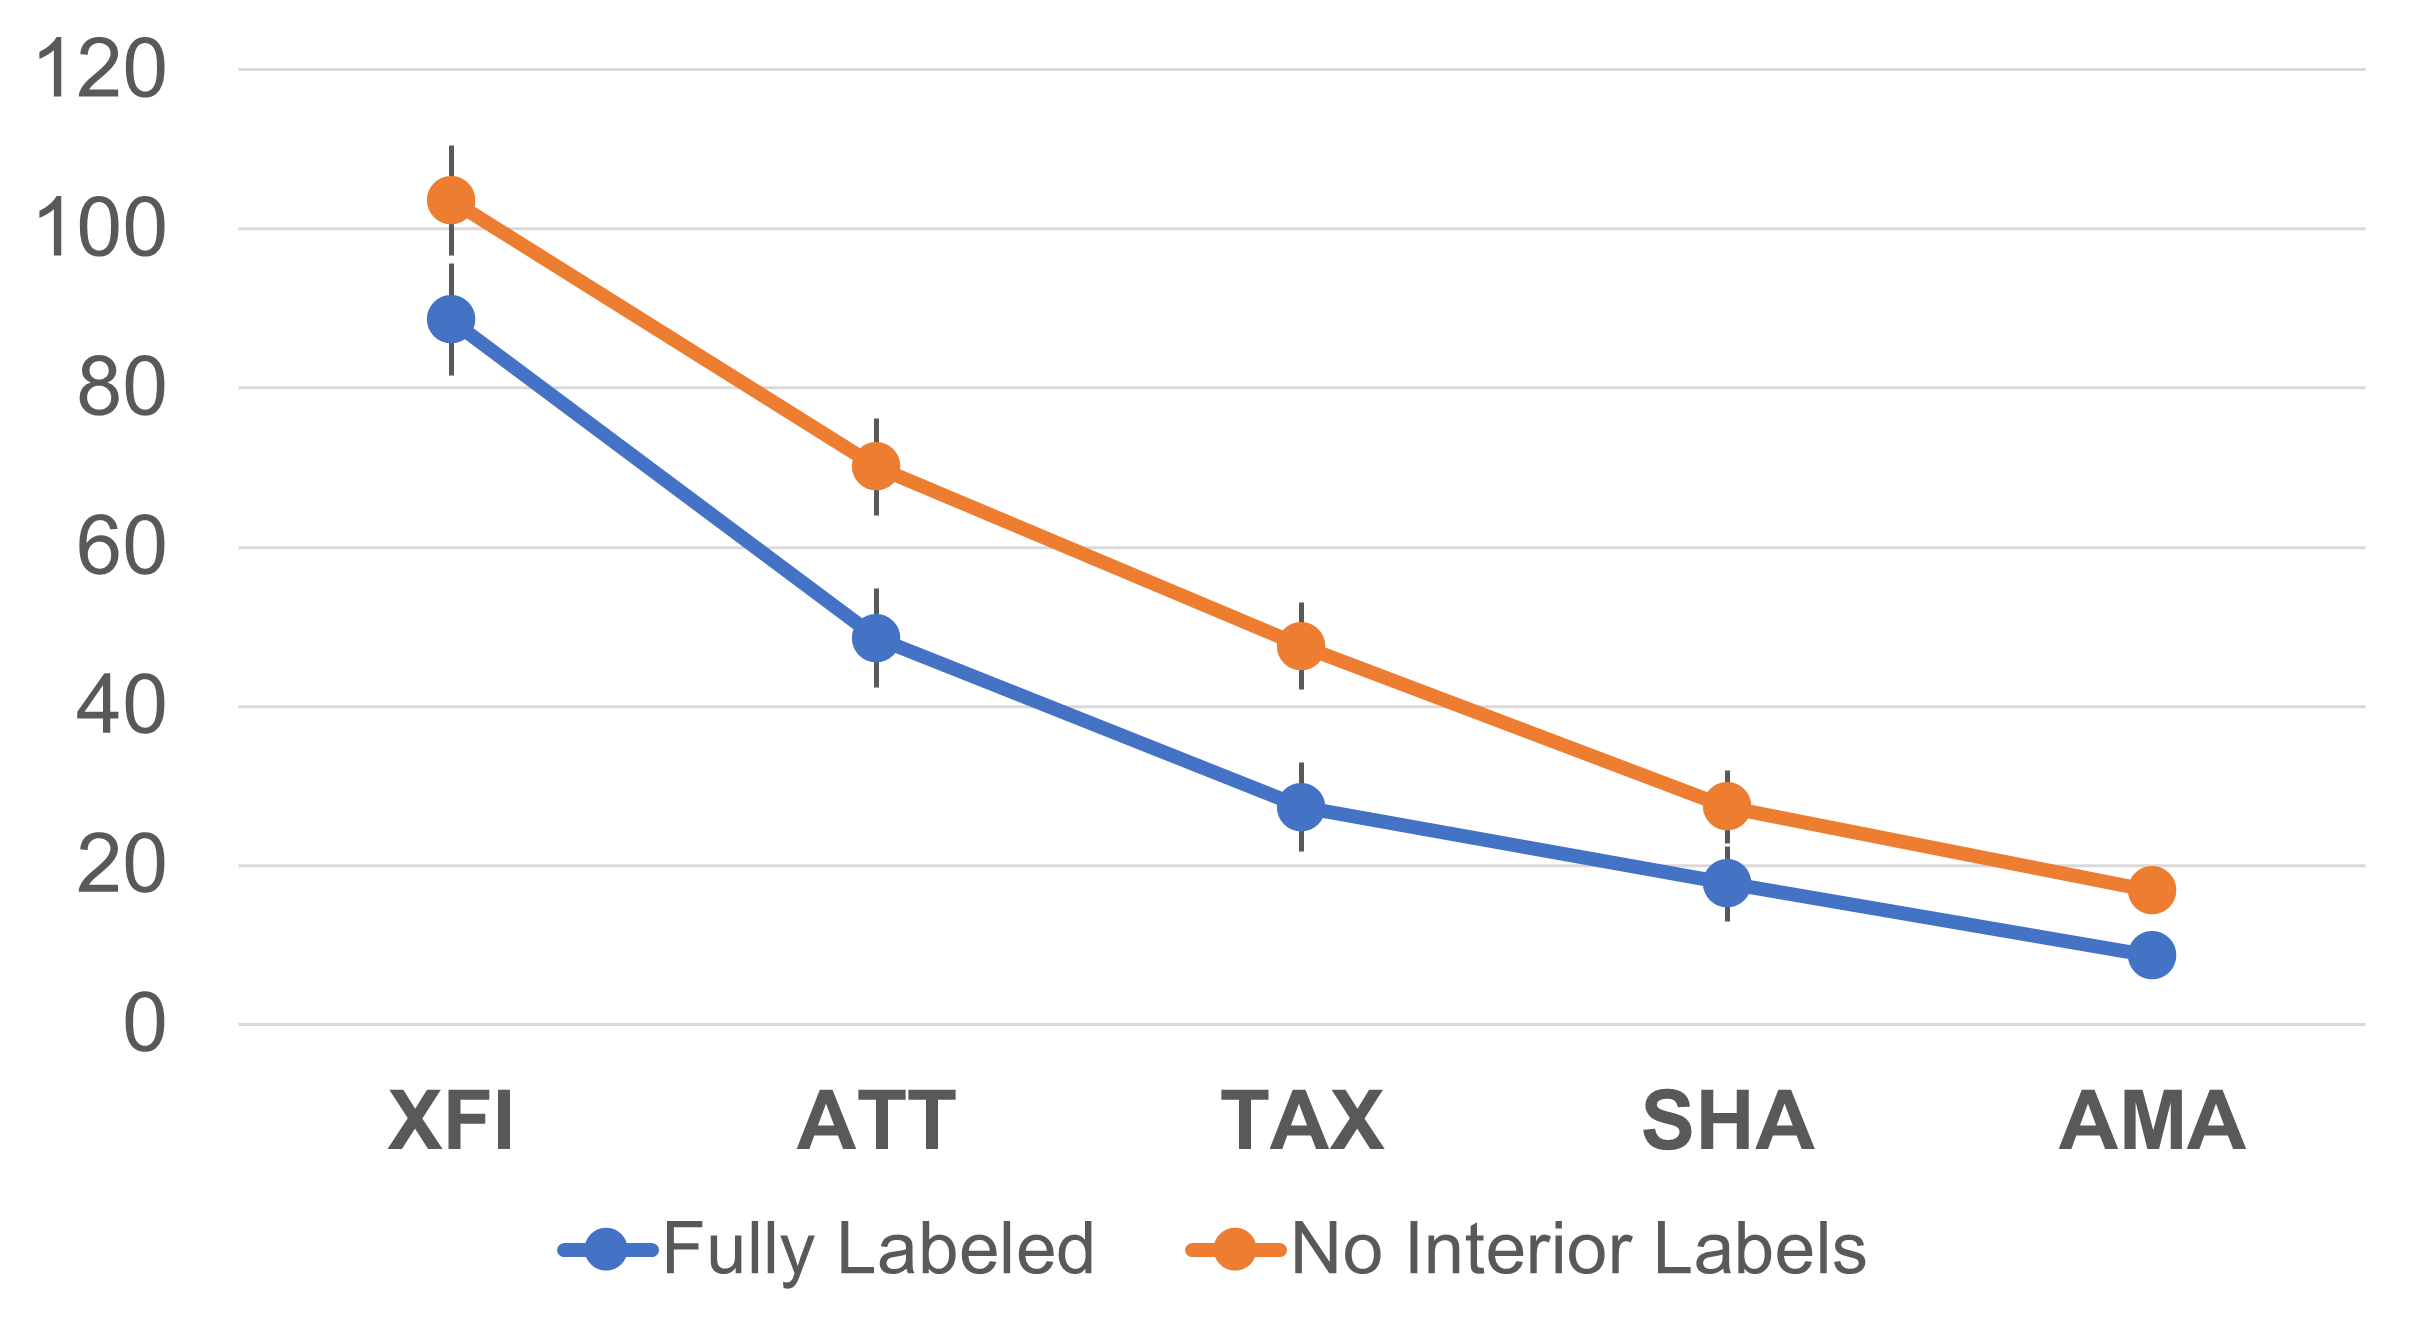
Figure 5: Interaction between format and task for SMEQ scale means.
We expected differences in task ratings because the tasks were specifically designed to cover a wide range from easy to difficult. More pertinent for the current investigation, the removal of the interior SMEQ labels consistently and significantly led respondents to give higher SMEQ ratings.
SMEQ Hotspot Means
As shown in Figure 6, the pattern of SMEQ hotspot means was almost the same as the SMEQ scale means. The 95% confidence intervals for four of the five tasks did not overlap (XFI was the exception). The ANOVA indicated significant main effects of task (F(4, 688) = 251.0, p < .0001, partial η2 = .59) and format (F(1, 172) = 62.5, p < .0001, partial η2 = .27), with a marginally significant interaction (F(4, 688) = 2.2, p = .07, partial η2 = .01).
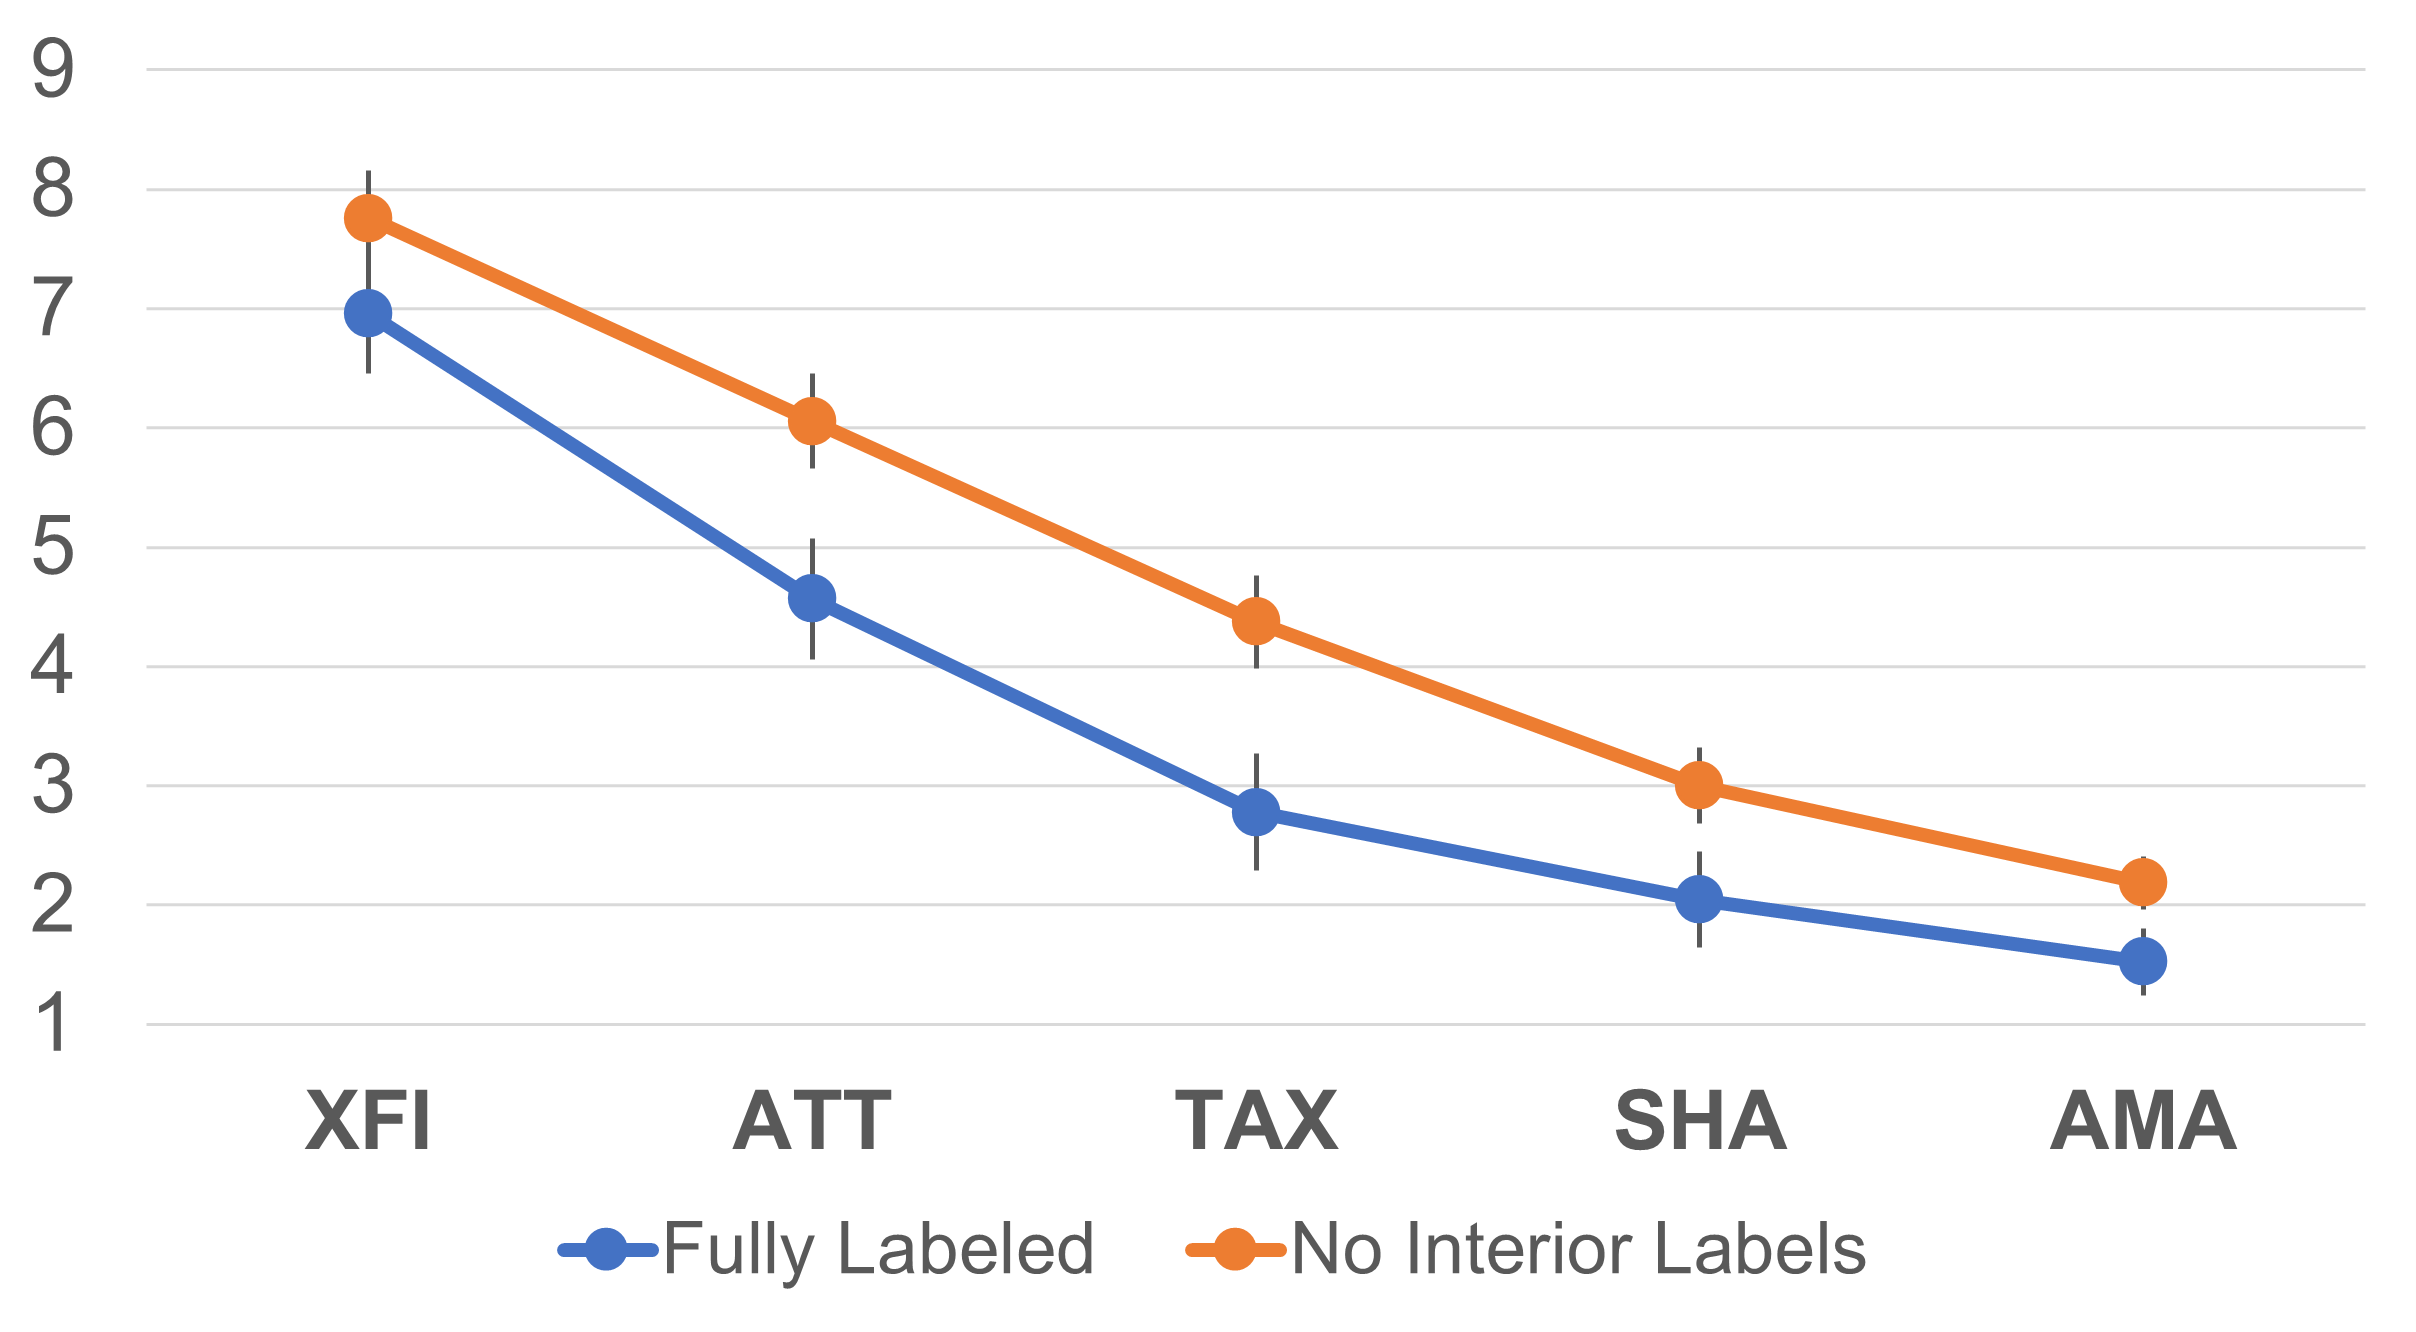
Figure 6: Interaction between format and task for SMEQ hotspot means.
SMEQ Hotspot Distributions
Figure 7 shows the distributions of selections across the nine hotspot regions.
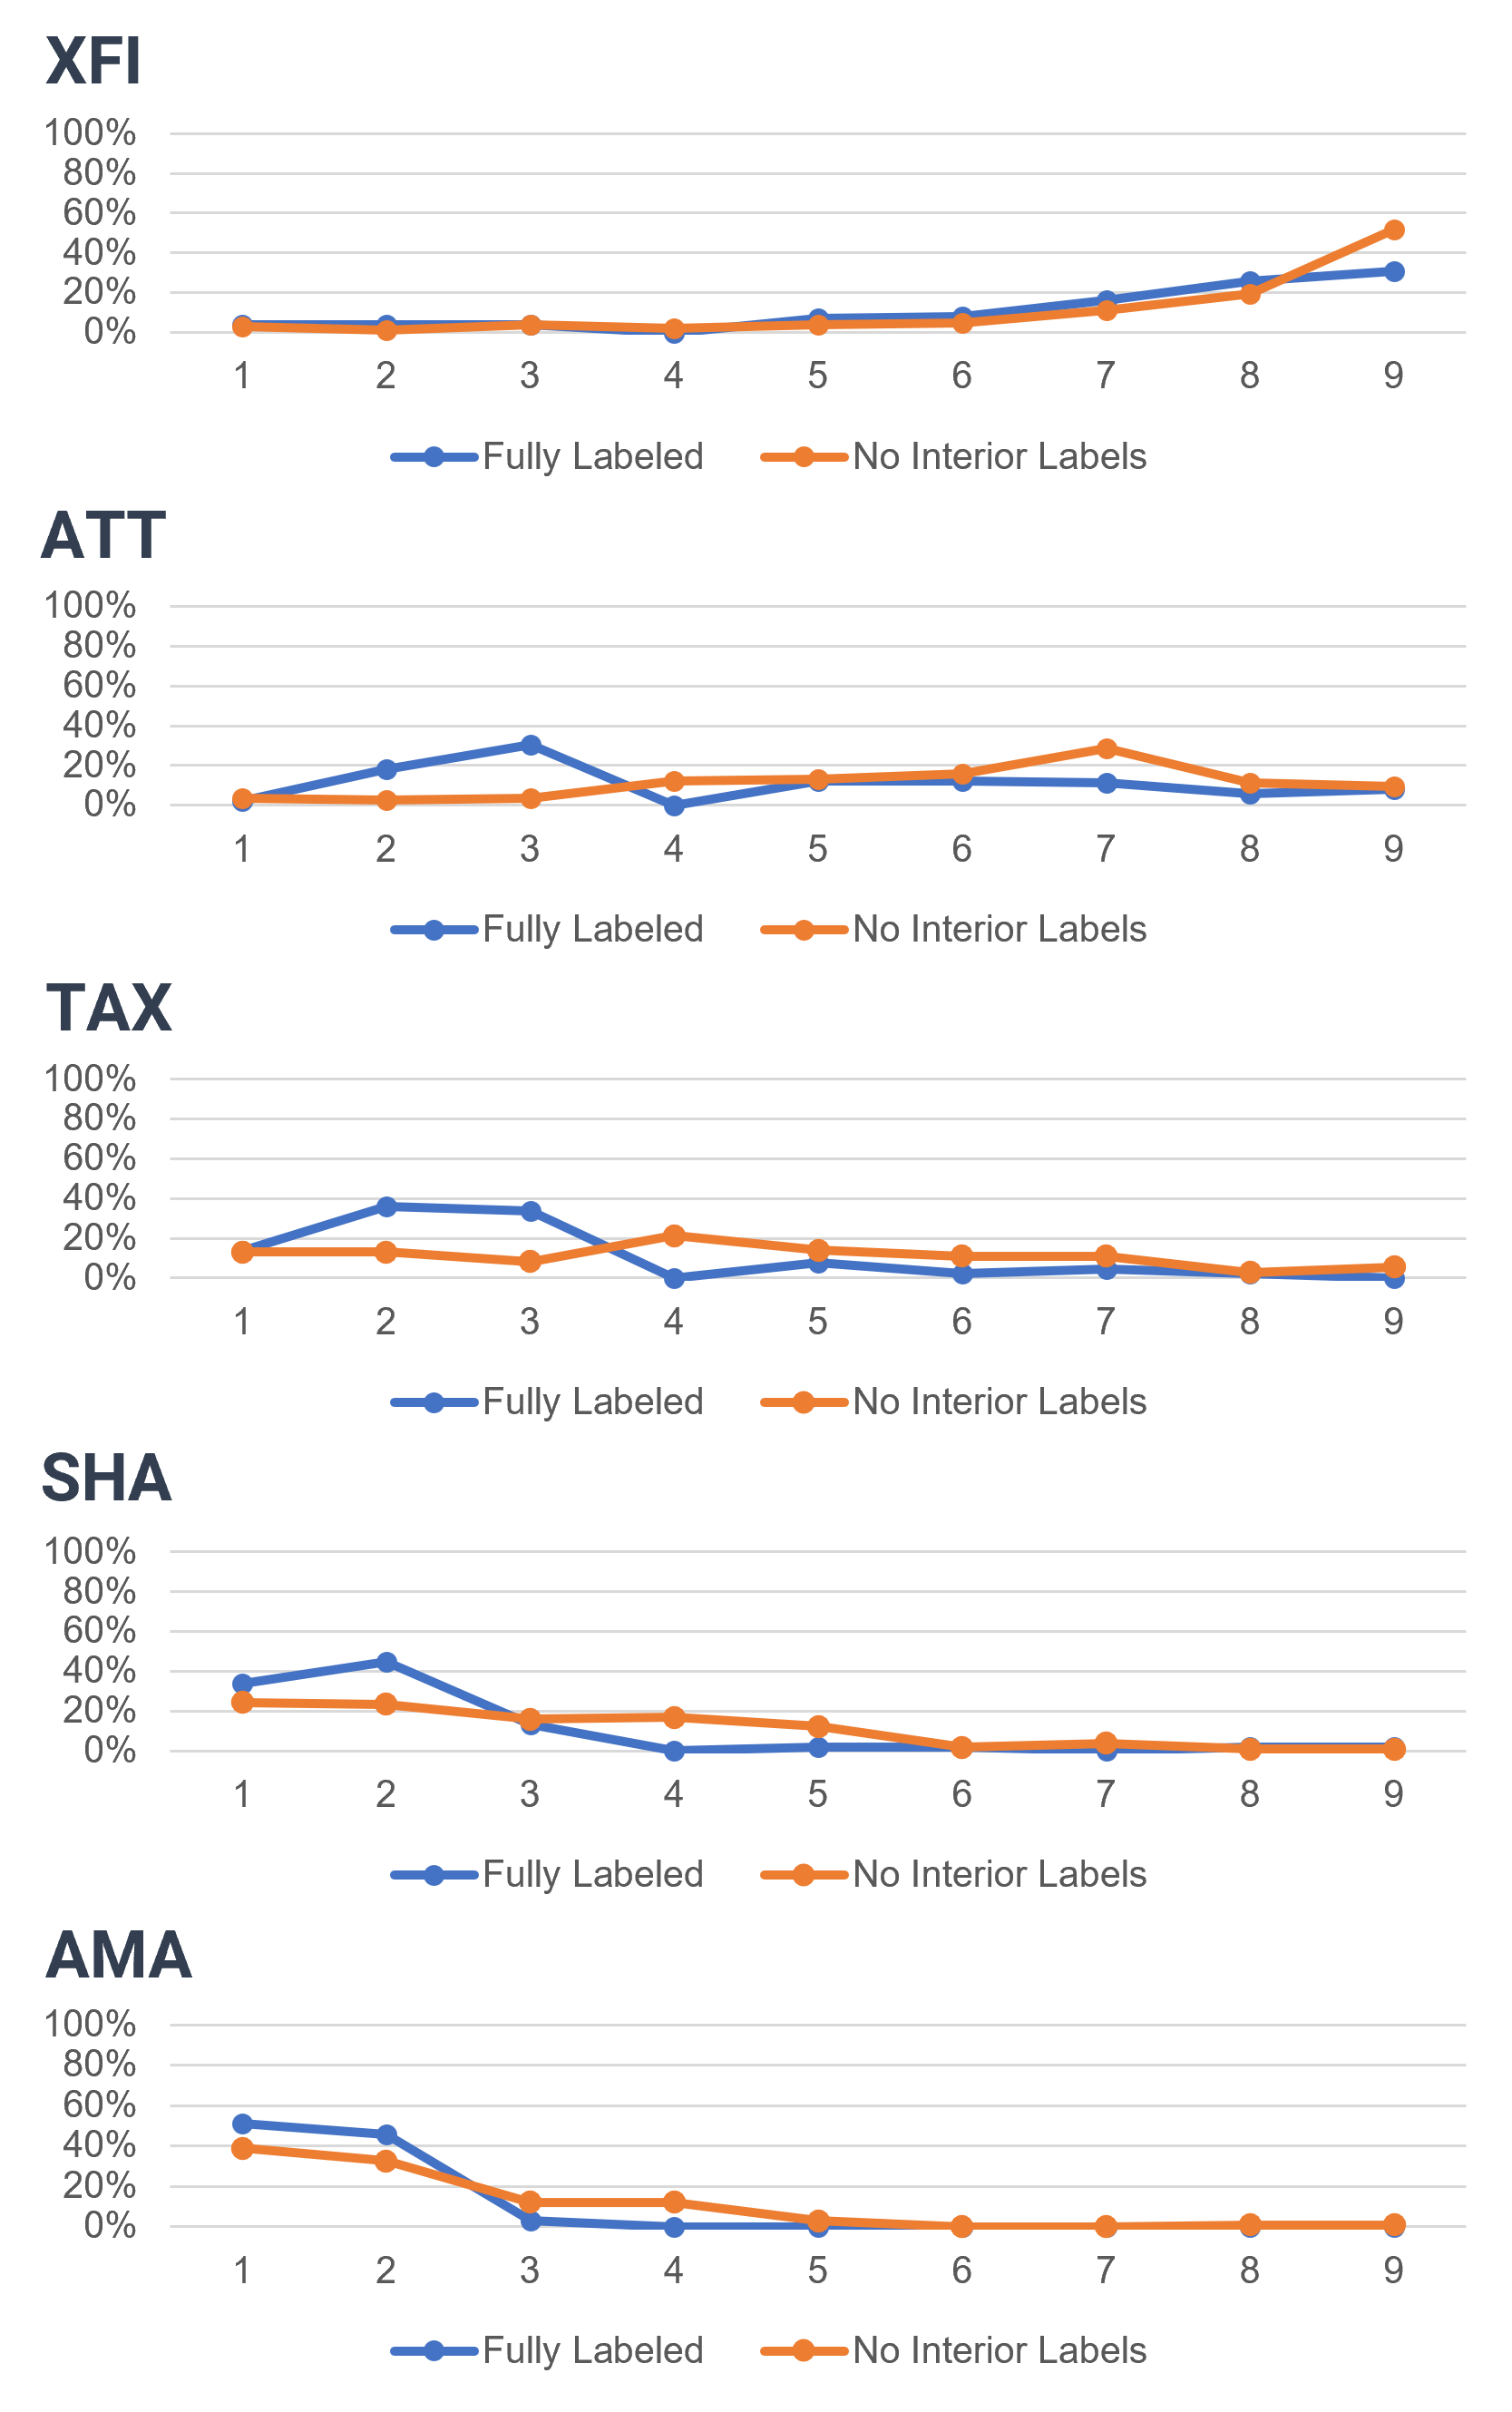
Figure 7: Distribution of percentages of SMEQ hotspot ratings by format and task.
For the most difficult task (XFI), there was little difference between the standard and alternate distributions. The exception was that the percentage selecting a point around the most difficult region (9: “Tremendously hard to do”) was significantly higher for the alternate format (Standard: 31.0%, Alternate: 51.9%, N−1 Two-Proportion Test Z = 3.0, p = .002).
As tasks became easier, the frequency of selection towards the lower numbers of the scale increased for both formats. The rate of that increase, however, was a bit faster for the standard format, keeping the means of the alternate format higher than those of the standard format. For the easiest task (AMA), the combined percentage for the easiest two regions (1: “Not at all hard to do,” 2: “Not very hard to do”) was significantly higher for the standard format (Standard: 96.9%, Alternate: 71.3%, N−1 Two-Proportion Test Z = 4.88, p < .0001).
SMEQ Standard Deviations
In an earlier article, we compared the standard deviation of the standard SMEQ collected in the February 2023 survey with that of the concurrently selected Single Ease Question (SEQ) because, all other things being equal, sample size requirements are smaller with metrics that have smaller standard deviations (i.e., the study is more efficient). To put the data on a common scale for comparison, we converted SMEQ and SEQ scores to 0–100-point scales where 0 is the poorest rating and 100 is the best. Across the five tasks, the mean standard deviations were 23.3 for the SEQ and 17.9 for the click SMEQ.
We noticed, however, that converting the SMEQ to a 0–100-point scale using its full possible range of 150 response options appeared to artificially reduce the standard deviation given that very few respondents selected values over 115 (just over the label “Tremendously hard to do”). When we rescaled the SMEQ by treating 115 as the highest possible score, its standard deviation increased to 23.3—the same as for the SEQ.
Applying these analyses to the data from the March 2023 data (the SMEQ without interior labels, same version of the SEQ), the standard deviations were 24.5 for the SEQ, 19.6 for the full-range SMEQ (0–150), and 25.6 for the reduced-range SMEQ (0–115), values that are only slightly higher than those from the February 2023 survey.
SEQ Differences Across Surveys
Given data from two independent surveys, it’s possible that some of the observed differences in the two versions of the SMEQ could be due to random differences in the samples. To check this, we conducted mixed ANOVAs on the SEQ (which had the same format in both surveys) and the SMEQ (which had different formats), with task as a within-subjects independent variable and survey as a between-subjects independent variable, with both dependent variables converted to 0–100-point scales. Focusing on the main effect of survey, we found significant differences for both dependent variables (SEQ: Survey 1 mean = 61.6, Survey 2 mean = 58.2, d = 3.4, F(1, 209) = 4.9, p = .03, partial η2 = .02; SMEQ: Survey 1 mean = 74.5, Survey 2 mean = 64.6, d = 9.9, F(1, 209) = 57.6, p < .0001, partial η2 = .22).
The SEQ differences indicate a slight but significant depression of perceived ease in Survey 2 (3.4 points), but this does not fully account for the SMEQ difference (9.9 points). The effect size (partial η2) of the SMEQ difference (.22) was about ten times that of the SEQ difference, confirming the tendency of respondents to rate the same tasks as easier when the SMEQ has its interior labels.
Discussion and Summary
We collected data from 211 participants who used the SMEQ (either with or without its internal labels) to rate the difficulty of completing five online tasks that varied significantly in how hard they were to do. We were curious about the effect of the presence or absence of interior labels on rating behaviors. Our key findings were:
Removing the interior labels of the SMEQ increased its scores by 10% of the scale range. Analyses of variance indicated statistically significant main effects of format for SMEQ scores and hotspot regions. Averaging across all tasks, the mean for the alternate format (no interior labels) was about 15 points higher than the standard format (an effect size of about 10% of the 0–150-point range of the SMEQ scale).
The effect of SMEQ interior labels on rating behavior was consistent across a wide range of task difficulties. The interaction between task and format was significant, but not crossed, so for every task, the SMEQ ratings with the alternate version were higher than those with the standard (whether measured with scores or hotspot regions).
Response distributions differed due to task difficulty. Examination of response distributions for the two formats showed that in the most difficult task (XFI), there was little difference in the selection of hotspot regions except for “Tremendously hard to do.” For the easiest task (AMA), the pattern was essentially reversed.
Key takeaway: Unlike the typically negligible effects of interior labeling on more commonly used rating scales, the interior labels of the SMEQ appear to have a relatively strong impact on ratings (an effect size of about 10% of the scale range), so we recommend using the standard version with the interior labels.