 For quantifying the user experience of a product, app, or experience, we recommend using a mix of study-level and task-based UX metrics.
In an earlier article, we provided a comprehensive guide to task-based metrics. Tasks can be included as part of usability tests or UX benchmark studies. They involve having a representative set of users attempt to accomplish a realistic goal, such as finding a movie to stream, selecting a product to purchase, or reserving a hotel room.
It’s not always feasible to assess a task experience because of challenges with budgets and timelines or access to products and users. Tasks tend to be more tightly focused than study-level metrics, and thus they can provide diagnostic information on what to fix. However, this granular focus on task performance may not be necessary for a specific business or research goal that is more focused on attitudes and intentions.
For example, it’s possible for participants to complete tasks quickly and easily but still not be very satisfied with the product because they don’t think it’s useful, and consequently, they are less inclined to recommend or continue using it.
Study-level metrics allow users to reflect upon a product experience more broadly. Even the most comprehensive study or benchmark can usually only capture the surface of what many users do with an interface. Study-level metrics often include a mix of overall satisfaction, perceived usability, perceived usefulness, and behavioral intentions (e.g., likelihood to purchase, likelihood to recommend).
They are called study-level metrics because they are typically asked only once in a study (unlike task metrics, which are collected for each attempted task). In this article, we describe several types of study-level metrics that cover many of the common post-study constructs businesses and research teams typically track. We’ll also cover these in our upcoming webinar/short course.
 1. Satisfaction Metrics
 1. Satisfaction Metrics
Satisfaction is a broad concept that includes metrics from a more general “relationship” level to more specific “attribute” level assessments.
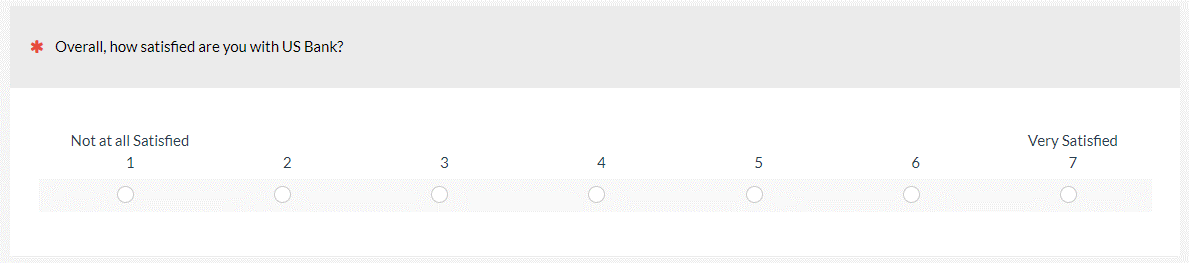
General Satisfaction: Simply ask respondents to rate how satisfied they are with a brand or company using a scale similar to the one in Figure 1.
There are also several branded satisfaction scales. A few of the better-known scales are the NSAT, CxPi, and ACSI.
Microsoft Net Satisfaction (NSAT): The NSAT is a four-point scale (Figure 2) that derives its “net” by taking the percentage of Very Satisfied (top-box) and subtracting the percentage of the two dissatisfied (bottom-two-box).

Customer Experience Index (CxPi): The market research company Forrester uses three five-point items to measure the CxPi. Respondents rate the extent to which companies meet their needs (see the UX-Lite), are easy to do business with (see the CES and SEQ), and are enjoyable to do business with. The score for each item is a top-box-minus-bottom-box net score, and the CxPi is the average of those three net scores.
American Consumer Satisfaction Index (ACSI): The ASCI uses a set of 14–20 ten-point items, surveying thousands of U.S. customers each year on products and services they’ve used. They provide a series of benchmark reports across dozens of industries, including computer hardware, Hotels, manufacturing, pet food, and life insurance, to name a few.
2. Loyalty Metrics
 2. Loyalty Metrics
Customers can be satisfied but not loyal. Expected loyalty is usually measured with behavioral intentions.
Intent to Use/Purchase: Asking customers or users their intent to continue using, purchase again, or continue subscribing. This is often asked using seven-, ten-, or eleven-point scales to generate better differentiation between extreme (top-box and bottom-box) responders.
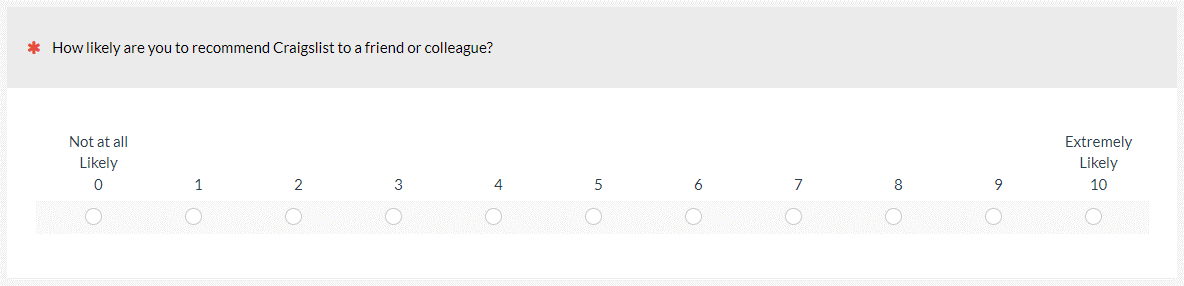
Likelihood to Recommend/Net Promoter Score (LTR/NPS): The Net Promoter Score has made a single eleven-point LTR item (how likely are you to recommend, 0 to 10—see Figure 3) famous/infamous, but this question existed before the NPS as a measure of “word of mouth” referral metrics that can be a good indicator of the “virality” of a product/brand or service. LTR is converted to the NPS by subtracting the bottom-six-box percentage from the top-two-box percentage.
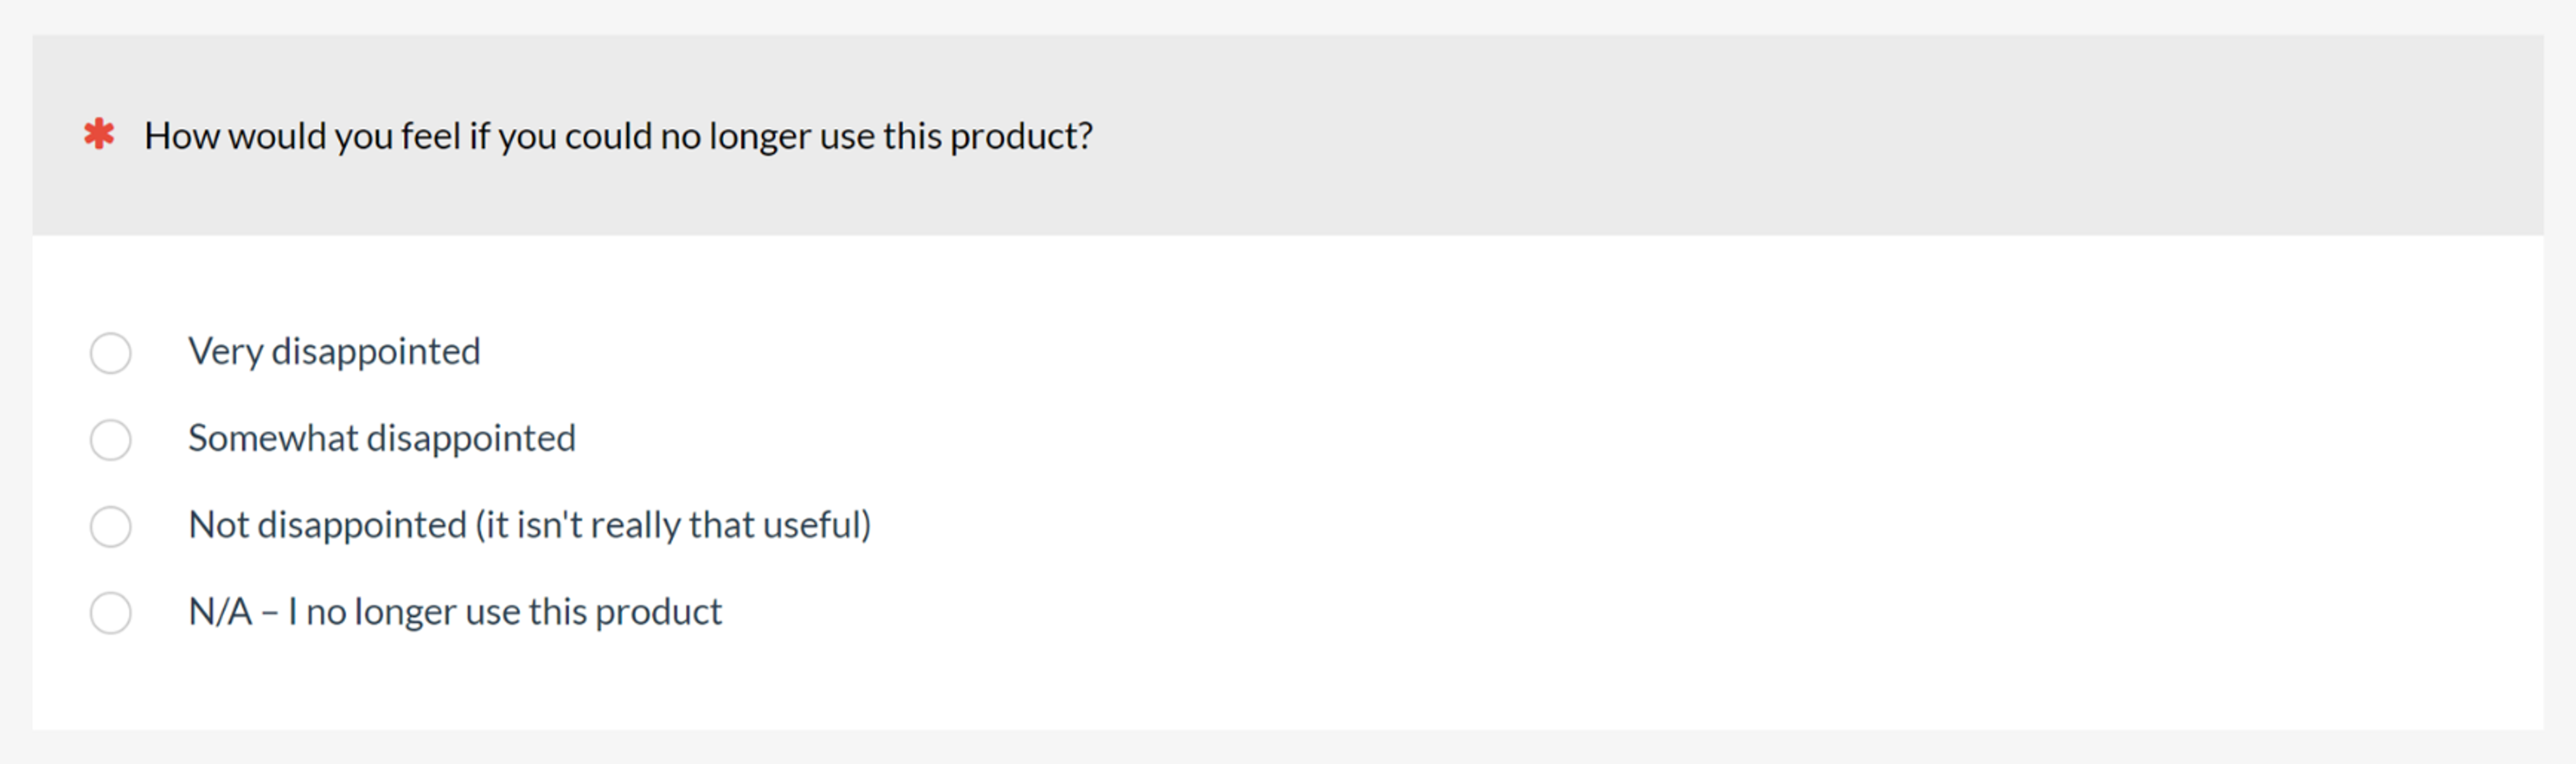
Product Market Fit (PMF): The PMF is a single item that asks users how they would feel if they could no longer use a product (Figure 4). The response options are various levels of disappointment. The standard scoring for the item is the top-box score—the percentage of Very Disappointed responses.
SUPR-Q Loyalty: This subscale of the SUPR-Q® is an average of intent to re-visit and intent to recommend specific to measuring website loyalty and normalized against a database of 250+ website scores.
3. Brand
 3. Brand
Perceptions of a brand consistently have a major influence on other study-level metrics such as satisfaction, ease, and loyalty.
Awareness: Brand awareness (are people familiar with a brand?) can be assessed using unaided and aided awareness questions. In unaided awareness, participants supply brand names for a category or product. For aided awareness, participants select brands they are familiar with from a list.
Attitude Toward Brand/Brand Favorability: Participants are asked to rate their favorability toward a familiar brand using one or more scales.
Brand Lift: Participants are asked to rate their brand attitude before a task or stimulus and again after the task or stimulus is completed. The difference in scores is examined; an increase is “lift”; a decrease is “drag.”
4. Usability/Usefulness Metrics
 4. Usability/Usefulness Metrics
There is a rich history of measures of perceived usability. They can be divided into four groups: traditional, web-focused, usability plus usefulness, and pragmatic/hedonic.
Traditional Usability
These post-study questionnaires are intended primarily for assessing subjective elements in usability testing across any interface type.
System Usability Scale (SUS): The ten-item SUS questionnaire is the most widely used questionnaire that provides a single measure of perceived usability.
Questionnaire for User Interaction Satisfaction (QUIS): Developed at the Human-Computer Interaction Lab at the University of Maryland, the QUIS is available in short and long versions (26 and 71 items). Respondents use bipolar semantic differentials to rate overall reaction and up to 11 specific interface factors.
Post-Study System Usability Questionnaire (PSSUQ): The PSSUQ was developed at IBM. The current version has 16 agreement items and produces four measures: Overall, System Usefulness, Information Quality, and Interface Quality.
Software Usability Measurement Inventory (SUMI): The SUMI has six subscales (global, efficiency, affect, helpfulness, control, and learnability) computed from the responses to 50 three-point items.
Web-Focused
There are at least two standardized questionnaires with a focus on website quality.
Website Analysis and Measurement Inventory (WAMMI): Based on the factor structure of SUMI, the WAMMI has the same six subscales computed from the responses to 60 rating items. The WAMMI was the first standardized UX questionnaire to focus on the web experience.
Standardized User Experience Percentile Rank Questionnaire (SUPR-Q): The SUPR-Q, similar to the WAMMI, focuses on the web experience. It’s a concise instrument, requiring just eight items to measure four UX attributes: Usability, Trust, Loyalty, and Appearance.
Usability Plus Usefulness
UX questionnaires that measure both usability (perceived ease-of-use) and perceived usefulness have been based on the Technology Acceptance Model and derivatives of the Usability Metric for User Experience.
Technology Acceptance Model (TAM): The 12-item TAM Model was originally developed to predict the likelihood of future use rather than user experience but has been modified for use as a standardized UX questionnaire (referred to as the mTAM).
Usability Metric for User Experience (UMUX): The UMUX is a four-item questionnaire that provides a measure of perceived usability with scores that match the SUS. It uses two positive and two negatively worded items with seven-point scales.
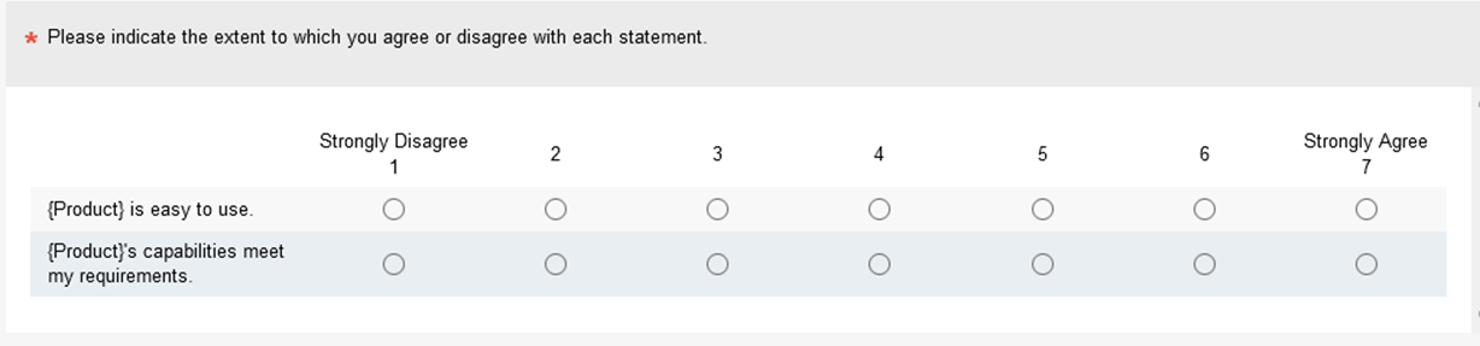
Usability Metric for User Experience-Lite (UMUX-Lite): The UMUX-Lite (Figure 5) uses two items from the UMUX. One addresses perceived usefulness (system capabilities meet my requirements), and the other addresses perceived ease-of-use, which is a good compact substitute for the TAM.
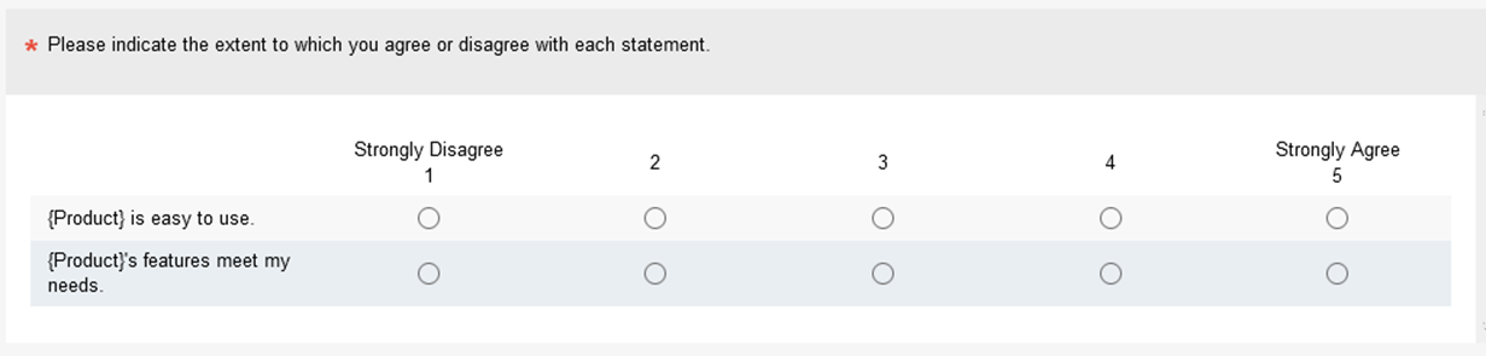
User Experience-Lite (UX-Lite): The UX-Lite® (Figure 6) is a simplified version of the UMUX-Lite in that its ease-of-use item is the same, but its usefulness item has simpler wording ({system}’s features meet my needs). The two items use five-point scales for easy integration with the SUS and SUPR-Q.
Pragmatic and Hedonic Usability
Since 2000, much research has been done on the distinction between classical (“pragmatic”) usability and hedonic usability, defined by a set of semantic differential items such as “interesting-boring” and “impressive-nondescript.” This line of research has produced three standardized questionnaires: AttrakDiff2, UEQ, and meCUE.
AttrakDiff2: The AttrakDiff2 consists of 28 seven-point semantic differential items (e.g., “confusing-clear” for pragmatic quality and “unusual-ordinary” for hedonic), providing measures of pragmatic quality and two aspects of hedonic quality: stimulation (novelty, challenge) and identification (self-expression). A short eight-item version is also available.
User Experience Questionnaire (UEQ): Similar to AttrakDiff2, the UEQ assesses pragmatic and hedonic quality with seven-point semantic differential items. Its 26 items subdivide pragmatic quality into Perspicuity, Efficiency, and Dependability, and hedonic quality into Novelty and Stimulation. A short eight-item version is also available.
Components of User Experience (modular evaluation) Questionnaire (meCUE): The meCUE is based on Thüring and Mahlke’s Components of User Experience (CUE) model, which was partially influenced by Hassenzahl’s early work. In the CUE model, which the design of the meCUE follows, the components are the perception of non-instrumental (hedonic) product qualities such as aesthetics, status, and commitment; emotions; and perception of instrumental (pragmatic) qualities such as perceived usefulness and perceived usability.
5. Delight
 5. Delight
The construct of delight is not well defined, with competing theories on what delight means. The more popular metrics involve multiple measures.
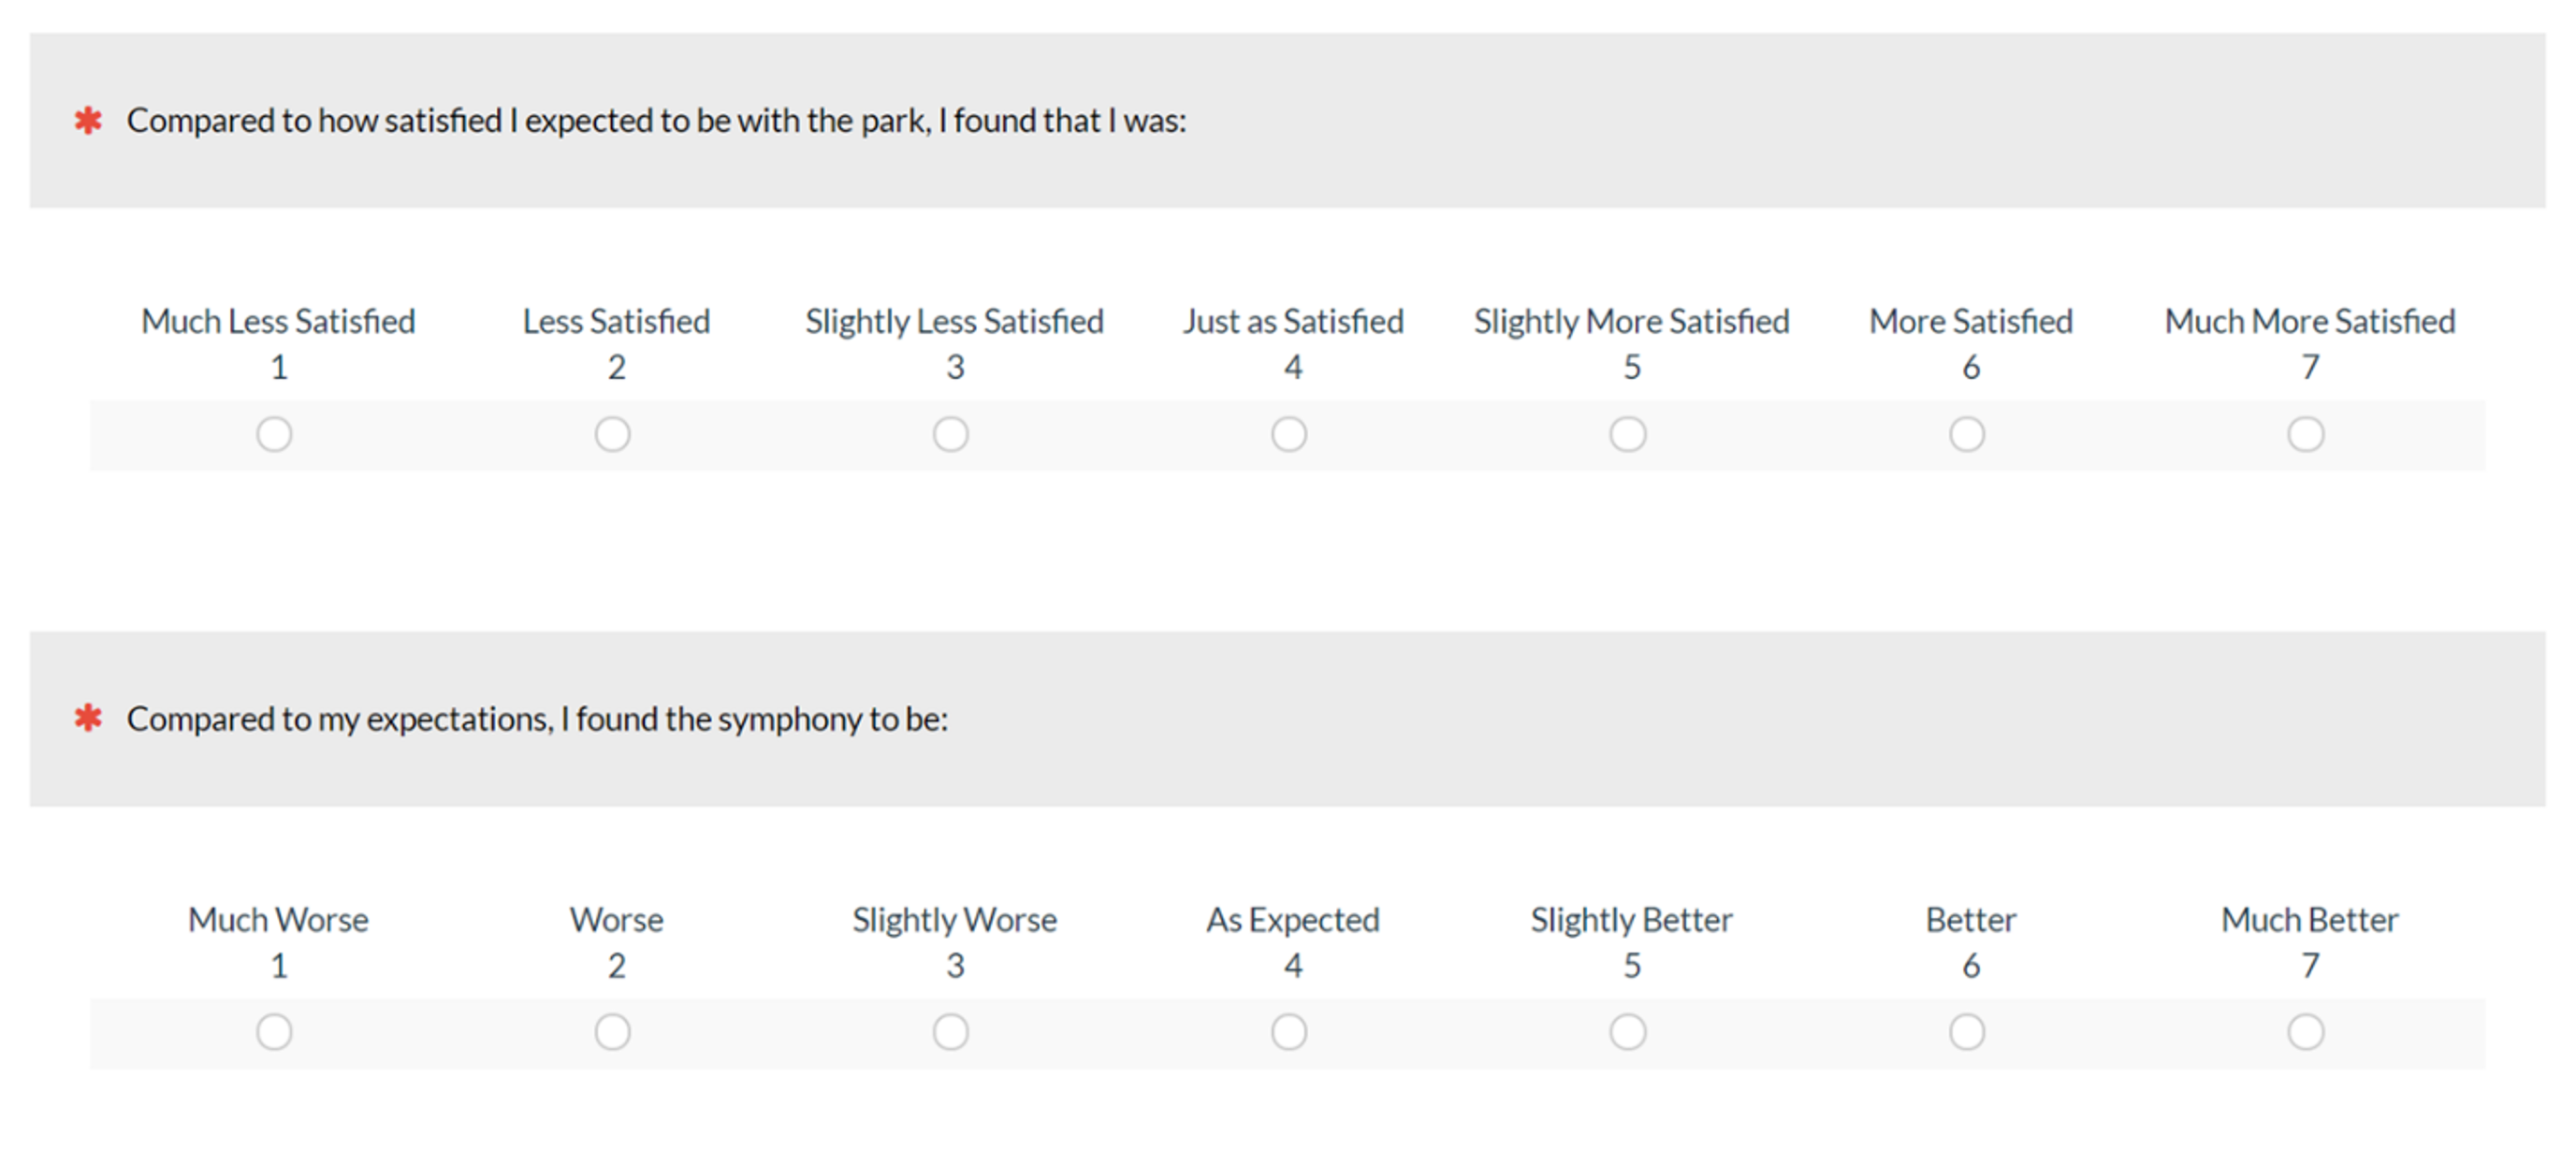
Two-item (joy, surprise): Asks respondents one question about satisfaction and another on expectations (see Figure 7).
Microsoft Desirability Toolkit/Reaction Cards: A list of 118 adjectives (mix of positive and negative) that participants select, typically after an experience using a product or interface. It’s unclear whether the Desirability toolkit actually measures desirability, and there are different ways to quantify the selections.
6. Trust
 6. Trust
Trust plays a major part in whether participants will conduct business on a website or with a brand.
SUPR-Q Trust: This subscale of the SUPR-Q is the mean of two items that measure attitudes toward credibility and trustworthiness. The normalized database works to assess websites, but the items can be used for any interface or brand (but only with raw values, not percentiles).
Modified System Trust Scale (MST): The MST is a standardized questionnaire for assessing system trust. It’s a 12-item instrument that measures two factors: system reliability/dependability and perceived risk.
7. Visual Design
 7. Visual Design
Since 2000, UX researchers have explored the relationship between usability and visual design, with some concluding that attractiveness increases the perception of usability and others finding that perceived usability increases the perception of beauty. Regardless of the causal direction, a comprehensive UX assessment should include the measurement of perceptions driven by visual design.
SUPR-Q Appearance: Two items of the SUPR-Q (attractive and clean/simple presentation) use the SUPR-Q normative database to measure attitudes towards a website’s appearance with percentiles. The items can also be used to measure the appearance of interfaces other than websites (but only with raw values, not percentiles).
Clutter Questionnaire: Our under-development Clutter Questionnaire assesses the overall perception of clutter, perceived clutter due to design elements (e.g., typography), and perceived clutter due to interface content (e.g., ads). Stay tuned for more on this metric.
8. Special Purpose Questionnaires
 8. Special Purpose Questionnaires
In addition to more fundamental standardized UX questionnaires, many special-purpose questionnaires are available to UX researchers. Here is a sample of such questionnaires for assessing voice applications, mobile apps, gaming, tech-savviness, and service quality.
Voice
The Mean Opinion Scale (MOS): The MOS and its variants are standardized questionnaires for the assessment of the quality of degraded or synthetic speech (e.g., text-to-speech, TTS). The original MOS had seven five-point items to assess speech intelligibility and naturalness. The latest variant, the MOS-X2, uses four eleven-point scale items to measure intelligibility, naturalness, prosody, and social impression.
Subjective Assessment of Speech System Interfaces (SASSI): The SASSI is a broader measure of general speech-system usability. The SASSI has 34 items using seven-point scales with six factors: System Response Accuracy (nine items), Likeability (nine items), Cognitive Demand (five items), Annoyance (five items), Habitability (four items), and Speed (two items).
Mobile Apps
Standardized User Experience Percentile Rank Questionnaire mobile (SUPR-Qm): The SUPR-Qm is a 16-item questionnaire that measures the quality of the user experience of a mobile app. It’s based on Item Response Theory, so items are calibrated from easiest to most difficult to answer. It can be administered adaptively, by using software so only a subset of items is presented, or non-adaptively, by using a short-form version.
Gaming
Game User Experience Satisfaction Scale (GUESS): The GUESS is a 55-item questionnaire that assesses nine constructs associated with video game satisfaction (usability/playability, narratives, play engrossment, enjoyment, creative freedom, audio aesthetics, personal gratification, social connectivity, and visual aesthetics). An 18-item short version is also available (two items per construct). GUESS items are seven-point agreement scales.
Tech-savviness
There is a belief that people’s tech-savviness can influence their experience when using digital products. We have explored several ways to assess tech-savviness by measuring what someone knows, what someone does or reports doing, and what someone feels (e.g., self-assessment attitudes).
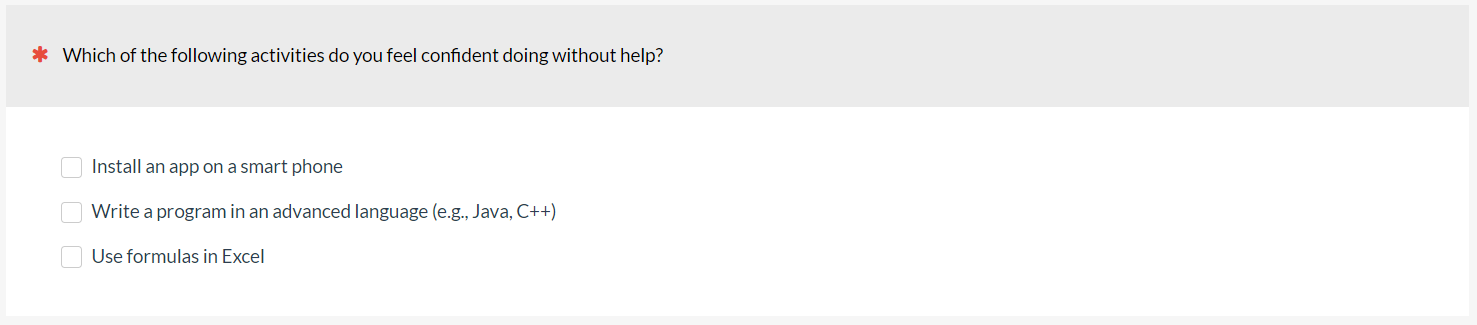
Skills-Based Selection: Asking participants to select which, if any, technical skills they have, such as installing a router or setting up a new phone (Figure 8).
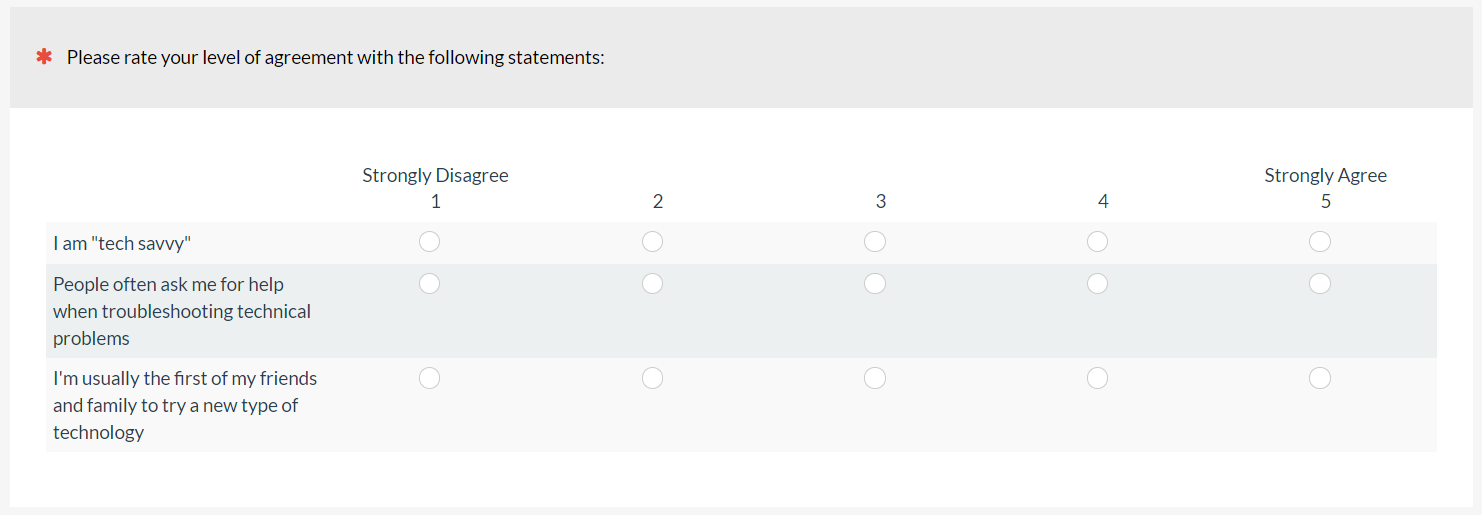
Rating-Based: Participants self-rate their technical savviness or ability on rating scales such as “I am tech savvy” (Figure 9).
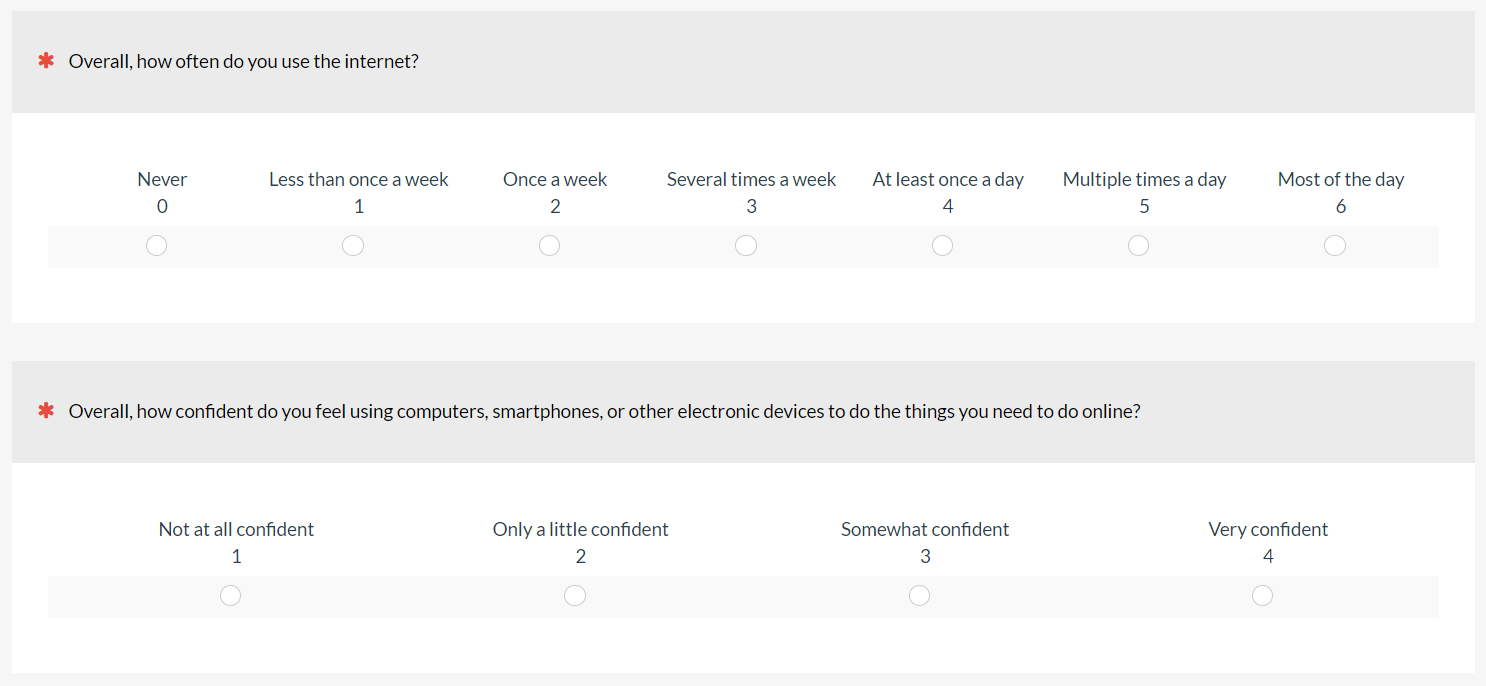
Pew Digital Savviness Classifier (PDS): Pew Research has used a two-item questionnaire (Figure 10) to assess digital savviness. Their three classification categories are Not Digitally Savvy (internet use less than once a day and not very confident), Very Digitally Savvy (internet use more than once a day and very confident), and Somewhat Digitally Savvy (all others).
Customer Service
Customer Effort Score (CES): The CES is a single seven-point item that asks customers their agreement on how easy it was to handle their issue (Figure 11, modified from its original five-point “effort” item).

Speech User Interface Service Quality (SUISQ): The SUISQ assesses the usability of Interactive Voice Response (IVR) applications. It was originally 25 items, but a modified version, the SUISQ-MR, has nine items that generate four factor scores: User Goal Orientation, Customer Service Behaviors, Speech Characteristics, and Verbosity.
Service Quality (SERVQUAL): The SERVQUAL questionnaire uses 22 seven-point agreement items to gauge the quality of service received from a company on five dimensions: Reliability, Assurance, Tangibles, Empathy, and Responsiveness.
Summary
In current practice, study-based UX metrics include measures of satisfaction, loyalty, brand perception, usability/usefulness, delight, trust, visual design, and special purpose questionnaires. We’ve provided key examples within these categories, but this is not an exhaustive list.
Satisfaction: Satisfaction metrics include short general assessments of satisfaction and branded scales such as Microsoft NSAT, Forrester CxPi, and the ACSI.
Loyalty: Loyalty is usually measured with behavioral intentions such as likelihood to recommend (the basis of the Net Promoter Score) and likelihood to continue using. For the PMF, users rate how disappointed they would be if they could no longer use a product or service.
Brand Perception: Brand perceptions consistently have a major influence on other study-level metrics. Brand perception can be measured by assessing brand awareness, attitudes toward a brand, and brand lift.
Usability/Usefulness: There is a rich history of the measurement of perceived usability (e.g., SUS, QUIS, PSSUQ, and SUMI) that, in the past few decades, has expanded to the measurement of perceived usefulness (e.g., TAM and UX-Lite), web-focused questionnaires (e.g., WAMMI and SUPR-Q), and hedonic aspects of use (AttrakDiff2, UEQ, and meCUE).
Delight: Standardized measurement of delight has been elusive. Two published methods are the two-item joy/surprise questionnaire and the Microsoft Desirability Toolkit/Reaction Cards.
Trust: Trust can play a major role in consumers’ decisions to interact with a website, service, or brand. Trust can be measured with the two-item SUPR-Q Trust scale or with the 12-item MST.
Visual Design: Comprehensive assessment of UX should include measurement of perceptions of the visual design. One way to measure this is with the SUPR-Q Appearance scale.
Special Purpose: Special purpose questionnaires are numerous. Examples of special UX metrics include those measuring voice interaction, mobile interaction, gaming, tech-savviness, and customer service.