 The number of scale points, labeling points, and biases toward the left side of a scale …
For over a hundred years, researchers have debated the effects of numerous rating scale attributes.
At MeasuringU, we’ve contributed to these debates, publishing empirical research to advance evidence-based practice in UX research. For some examples, see our summary articles (e.g., Rating Scales: Myth vs. Evidence and Rating Scale Best Practices: 8 Topics Examined).
Recently, as part of a larger experiment, we had a chance to test the effect of scale orientation (horizontal vs. vertical). Intuitively, it seems like scale orientation could have a significant effect on rating behavior.
With more and more people taking surveys on mobile devices, this attribute has become important to understand, because the most common orientation on computer monitors is horizontal (Figure 1). Due to screen size constraints, the most common orientation for mobile is vertical (Figure 2), especially when there are more than just a few response options.
If scale orientation significantly affects rating behavior, then the current practice of switching orientation to better suit mobile devices is problematic.
In this article, we briefly review the literature we found comparing horizontal and vertical orientations and present and discuss our own findings.
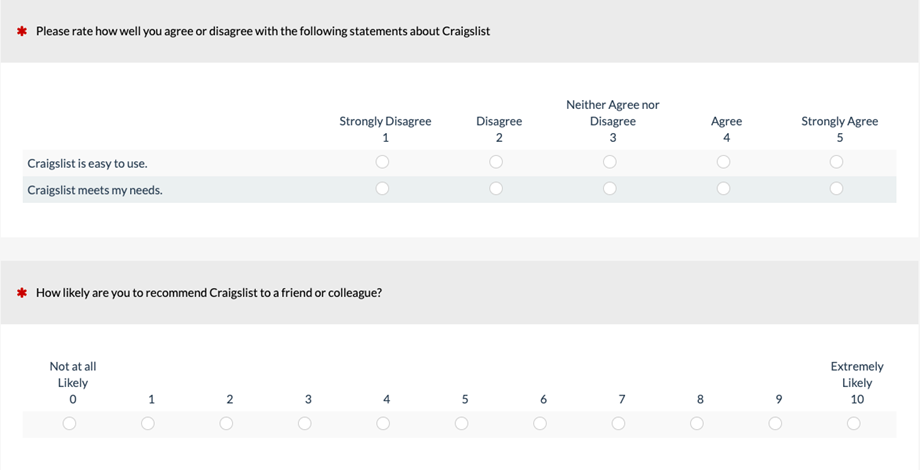
Figure 1: Scale orientation on a computer monitor for the five-point UX-Lite™ and the eleven-point Likelihood-to-Recommend (LTR) items (created with MUIQ®).
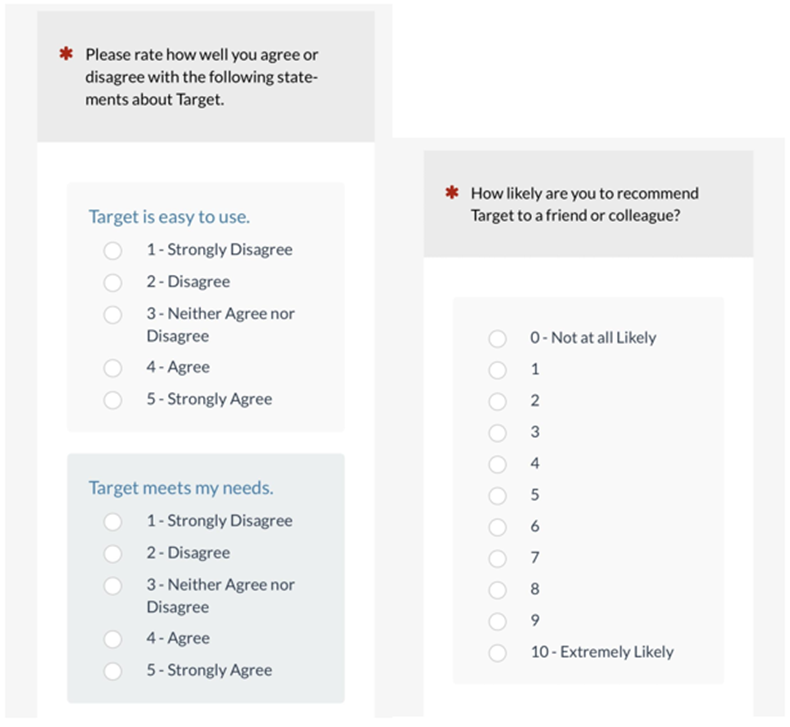
Figure 2: Scale orientation on a mobile phone for the five-point UX-Lite and the eleven-point Likelihood-to-Recommend items (created with MUIQ).
Previous Studies Suggest a Minor and Inconsistent Impact
The available empirical literature on scale orientation suggests that, surprisingly, this attribute might not have that much effect on ratings.
Friedman and Friedman (1994) had two independent groups of respondents rate the status of six different occupations with five-point scales. One group used scales with a horizontal orientation (n = 104), and the other used scales with a vertical orientation (n = 103). There was no significant difference for three occupations. The difference was significant for the three other occupations, but the direction of the effect was not consistent, with the vertical scale producing higher ratings for two occupations and lower ratings for the third. Averaging across all six items, the mean difference was .03 (0.7% of the range of a 1–5-point scale).
In 2012, at the annual conference of the American Association for Public Opinion Research, Saunders et al. presented a paper that included a comparison of scale orientations [PDF]. Of the 1,505 respondents in their research, 40% completed the survey on a PC and 60% on the mobile website.
Their experimental design allowed the comparison of vertical and horizontal orientations on both computer displays and mobile devices. Additionally, items were organized either in grids or presented separately. They found the highest completion rates with the horizontal grid, faster completion times with grids, and longer completion times for mobile.
They found no significant differences in ratings between PC and mobile groups, and “no differences based on whether respondents received horizontal or vertical scales or whether their nine attributes appear as a grid or as nine individual rating scale questions” (p. 19).
More recently, Mockovak (2018, Bureau of Labor Statistics [PDF]) compared scale orientation and grids in online data collection of six items (horizontal n = 193; vertical n = 229). He used Mechanical Turk as the source for respondents and was not able to track whether respondents were completing their assigned survey on a computer or mobile device. He found no significant difference in orientation on ratings for five of the six items; for one item the mean was significantly higher for the horizontal orientation. The analyses also included examination of data quality (e.g., reliability, straight-lining, item nonresponse, and factor structure). He concluded, “in summary, the question formats studied did not consistently affect the results or associated measures of data quality for the questions in this study” (p. 1).
Our Study: Horizontal Desktop vs. Vertical Mobile
Similar to our other experiments assessing rating scale effects, we included scales of different lengths with which participants assessed multiple experiences.
Experimental Design
We set up a Greco-Latin experimental design for a within-subjects comparison of UX-Lite and LTR ratings of one of each type of online shopping website: mass merchants (Amazon, Walmart, Target, Walgreens, CVS, Wayfair) and seller marketplaces (Craigslist, eBay, Etsy, Facebook Marketplace).
Specifically, 212 participants from a U.S. panel agency rated the shopping environments in late January 2021. There were 103 participants who completed the survey on a mobile phone and 109 who completed the survey on a desktop computer. Across the experiment, this design controlled for the “nuisance” variables of Type of Website and Order of Presentation, allowing us to focus on the between-subjects independent variable of Orientation (Horizontal: Desktop vs. Vertical: Mobile—as shown in Figures 1 and 2).
One aspect of the experimental design that could be considered a weakness is the confounding between the desktop/mobile platforms and the horizontal/vertical orientations. On the other hand, from a pragmatic perspective, these combinations of platform and orientation match what researchers commonly do, either by design or by the automatic detection of mobile devices by the survey software.
If comparisons of these two experimental conditions indicate different rating behavior, then an appropriate follow-up experiment would be to construct a full factorial design to disentangle the confounding variables. If results indicate no statistically or practically significant differences, then that finding would be of value to researchers even with the confounding.
Results
UX-Lite (five-point scales)
Figure 3 shows the magnitudes of the UX-Lite scores (computed from a linear interpolation of its two items), which were not significantly different (t(210) = 0.56, p = .58), with an observed difference of 1.5 points on a 0–100-point scale (95% confidence interval ranged from −3.9 to 7.0).
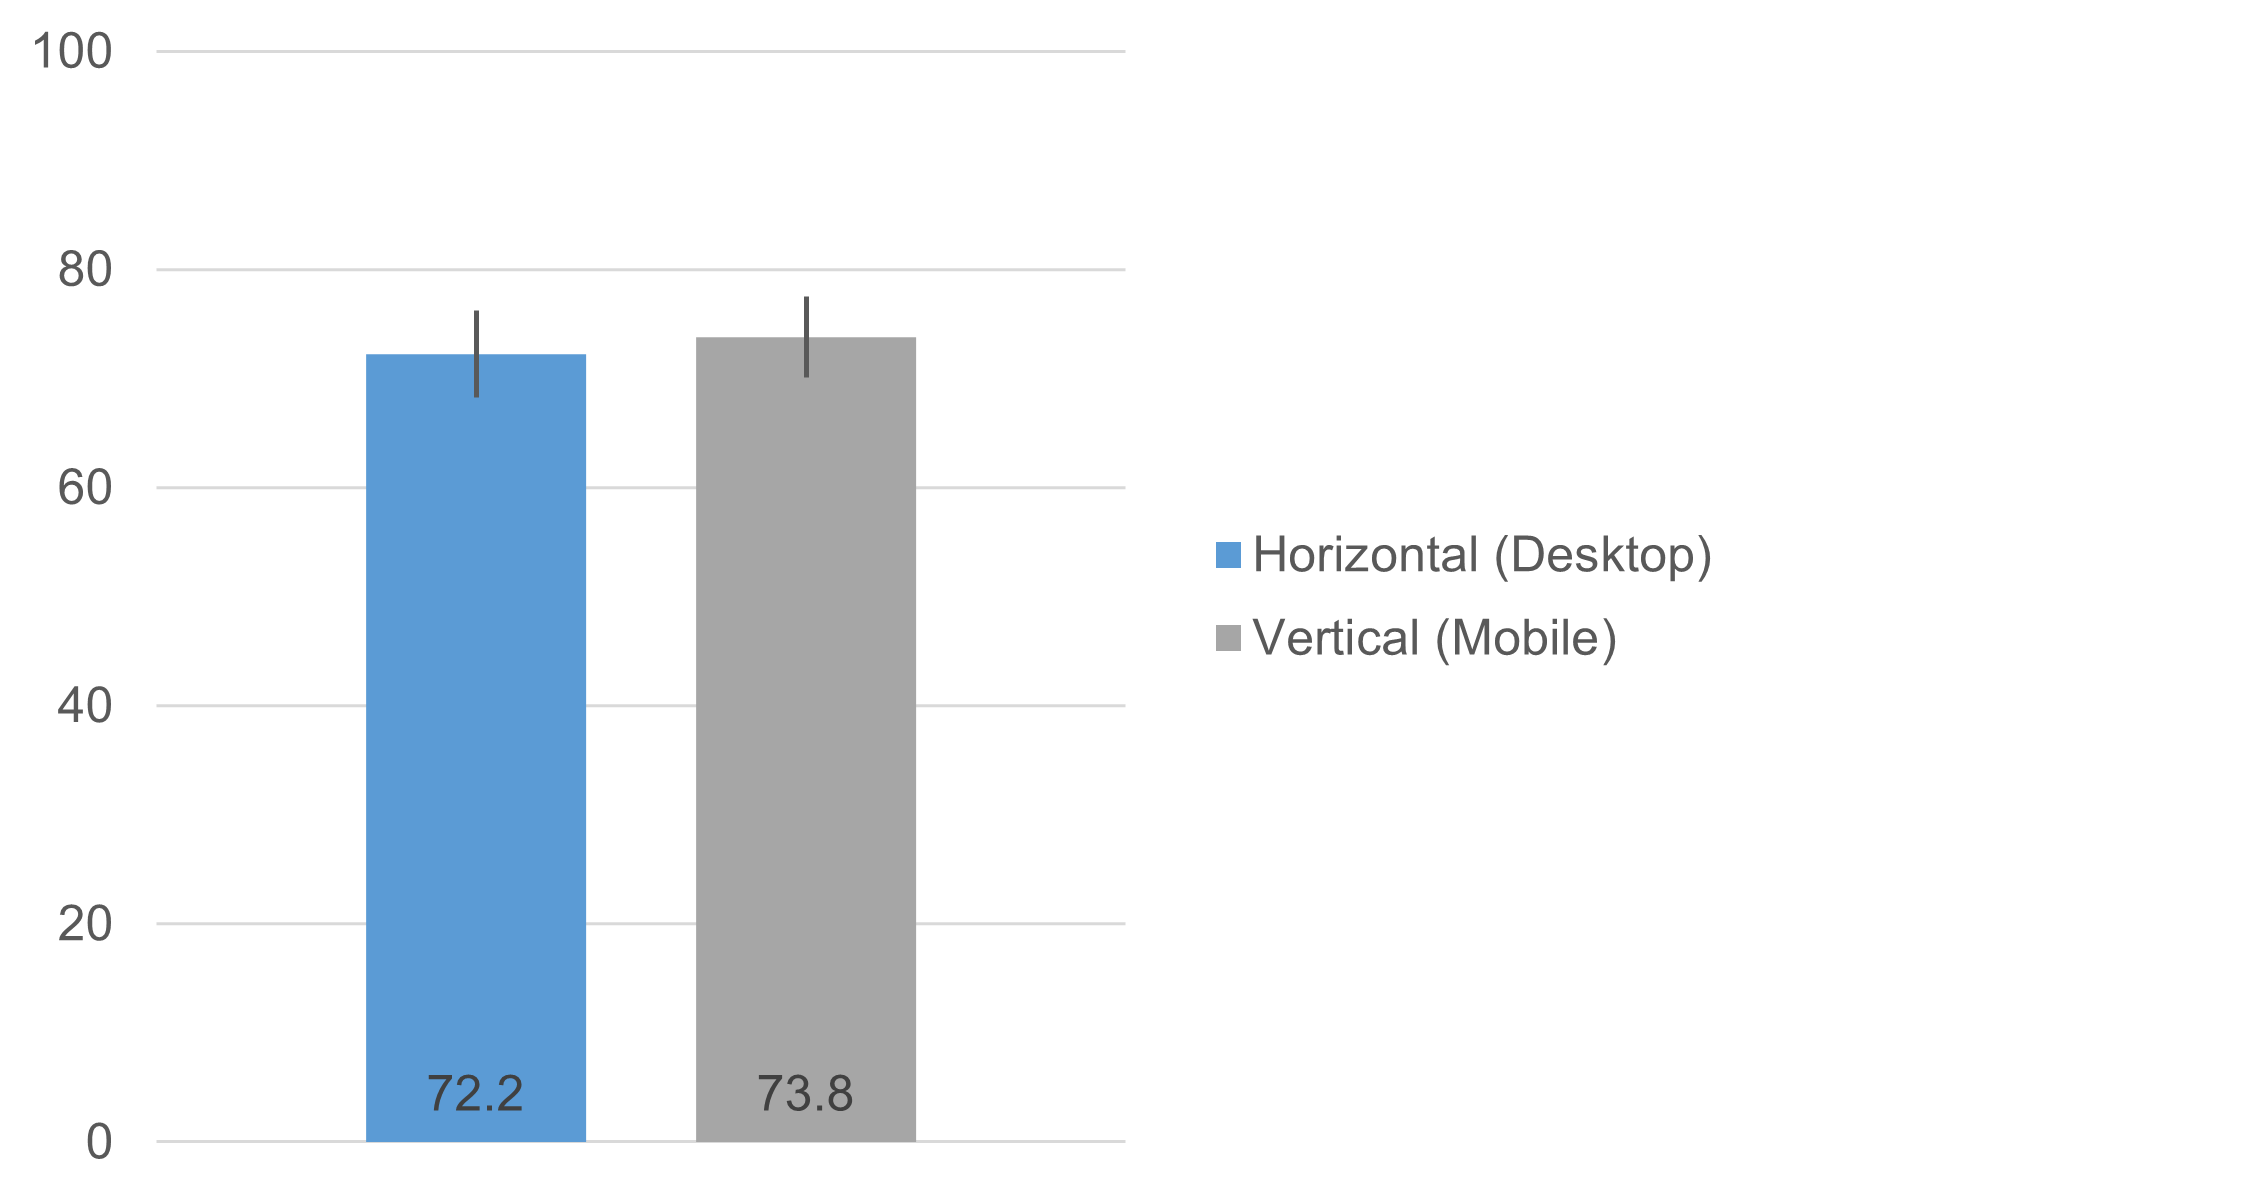
Figure 3: UX-Lite means for horizontal (desktop) and vertical (mobile) orientations (with 95% confidence intervals) were not statistically significant.
Figures 4 and 5 show the response distributions for the two items of the UX-Lite (Ease and Usefulness).
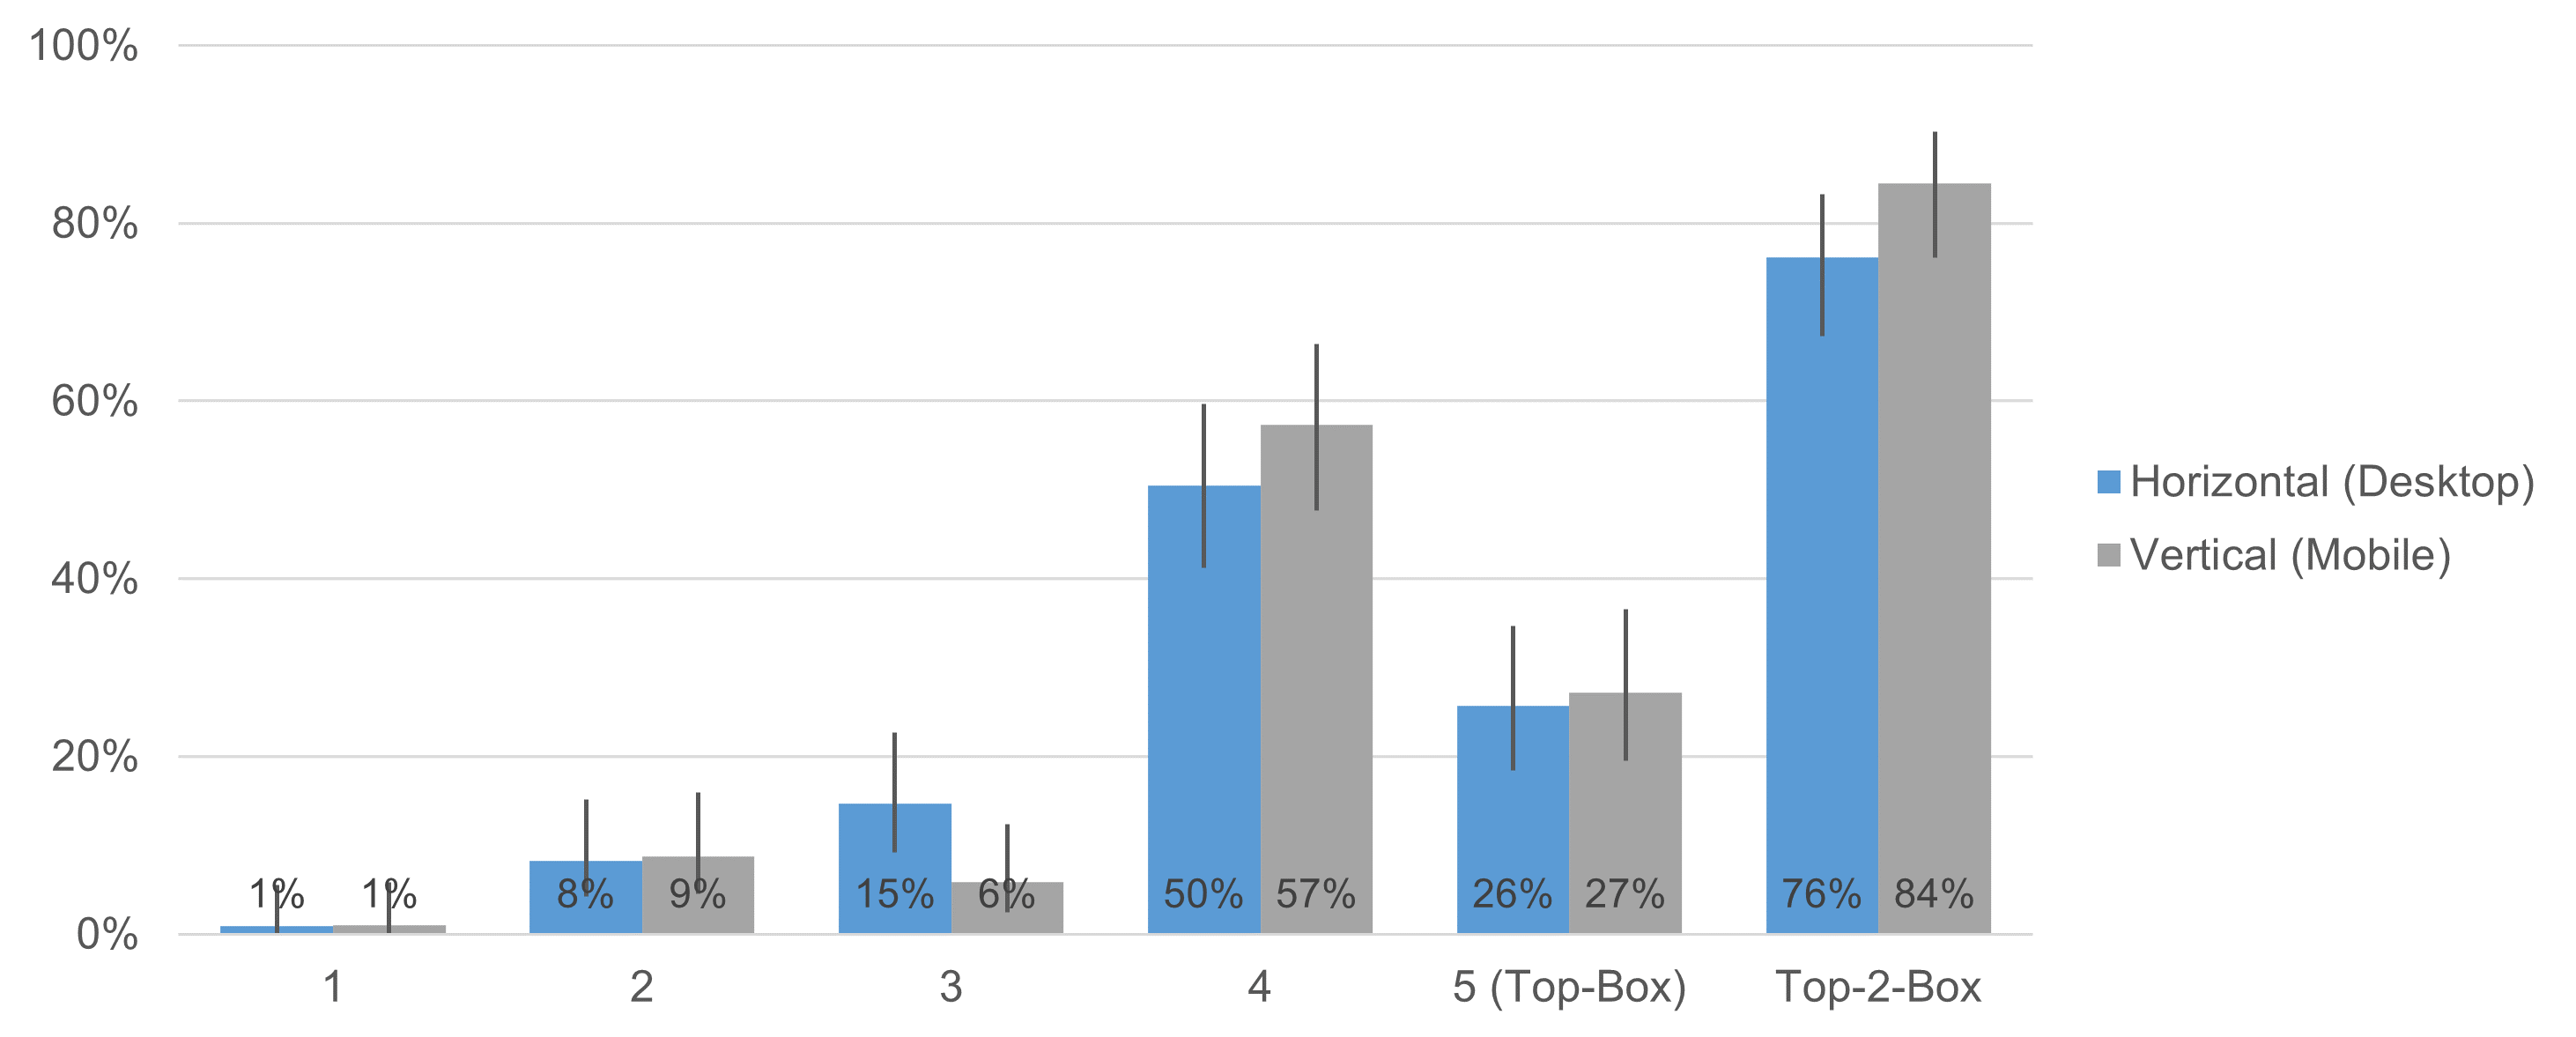
Figure 4: Response distributions of the UX-Lite Ease item for horizontal (desktop) and vertical (mobile) orientations (with 95% adjusted-Wald binary confidence intervals).
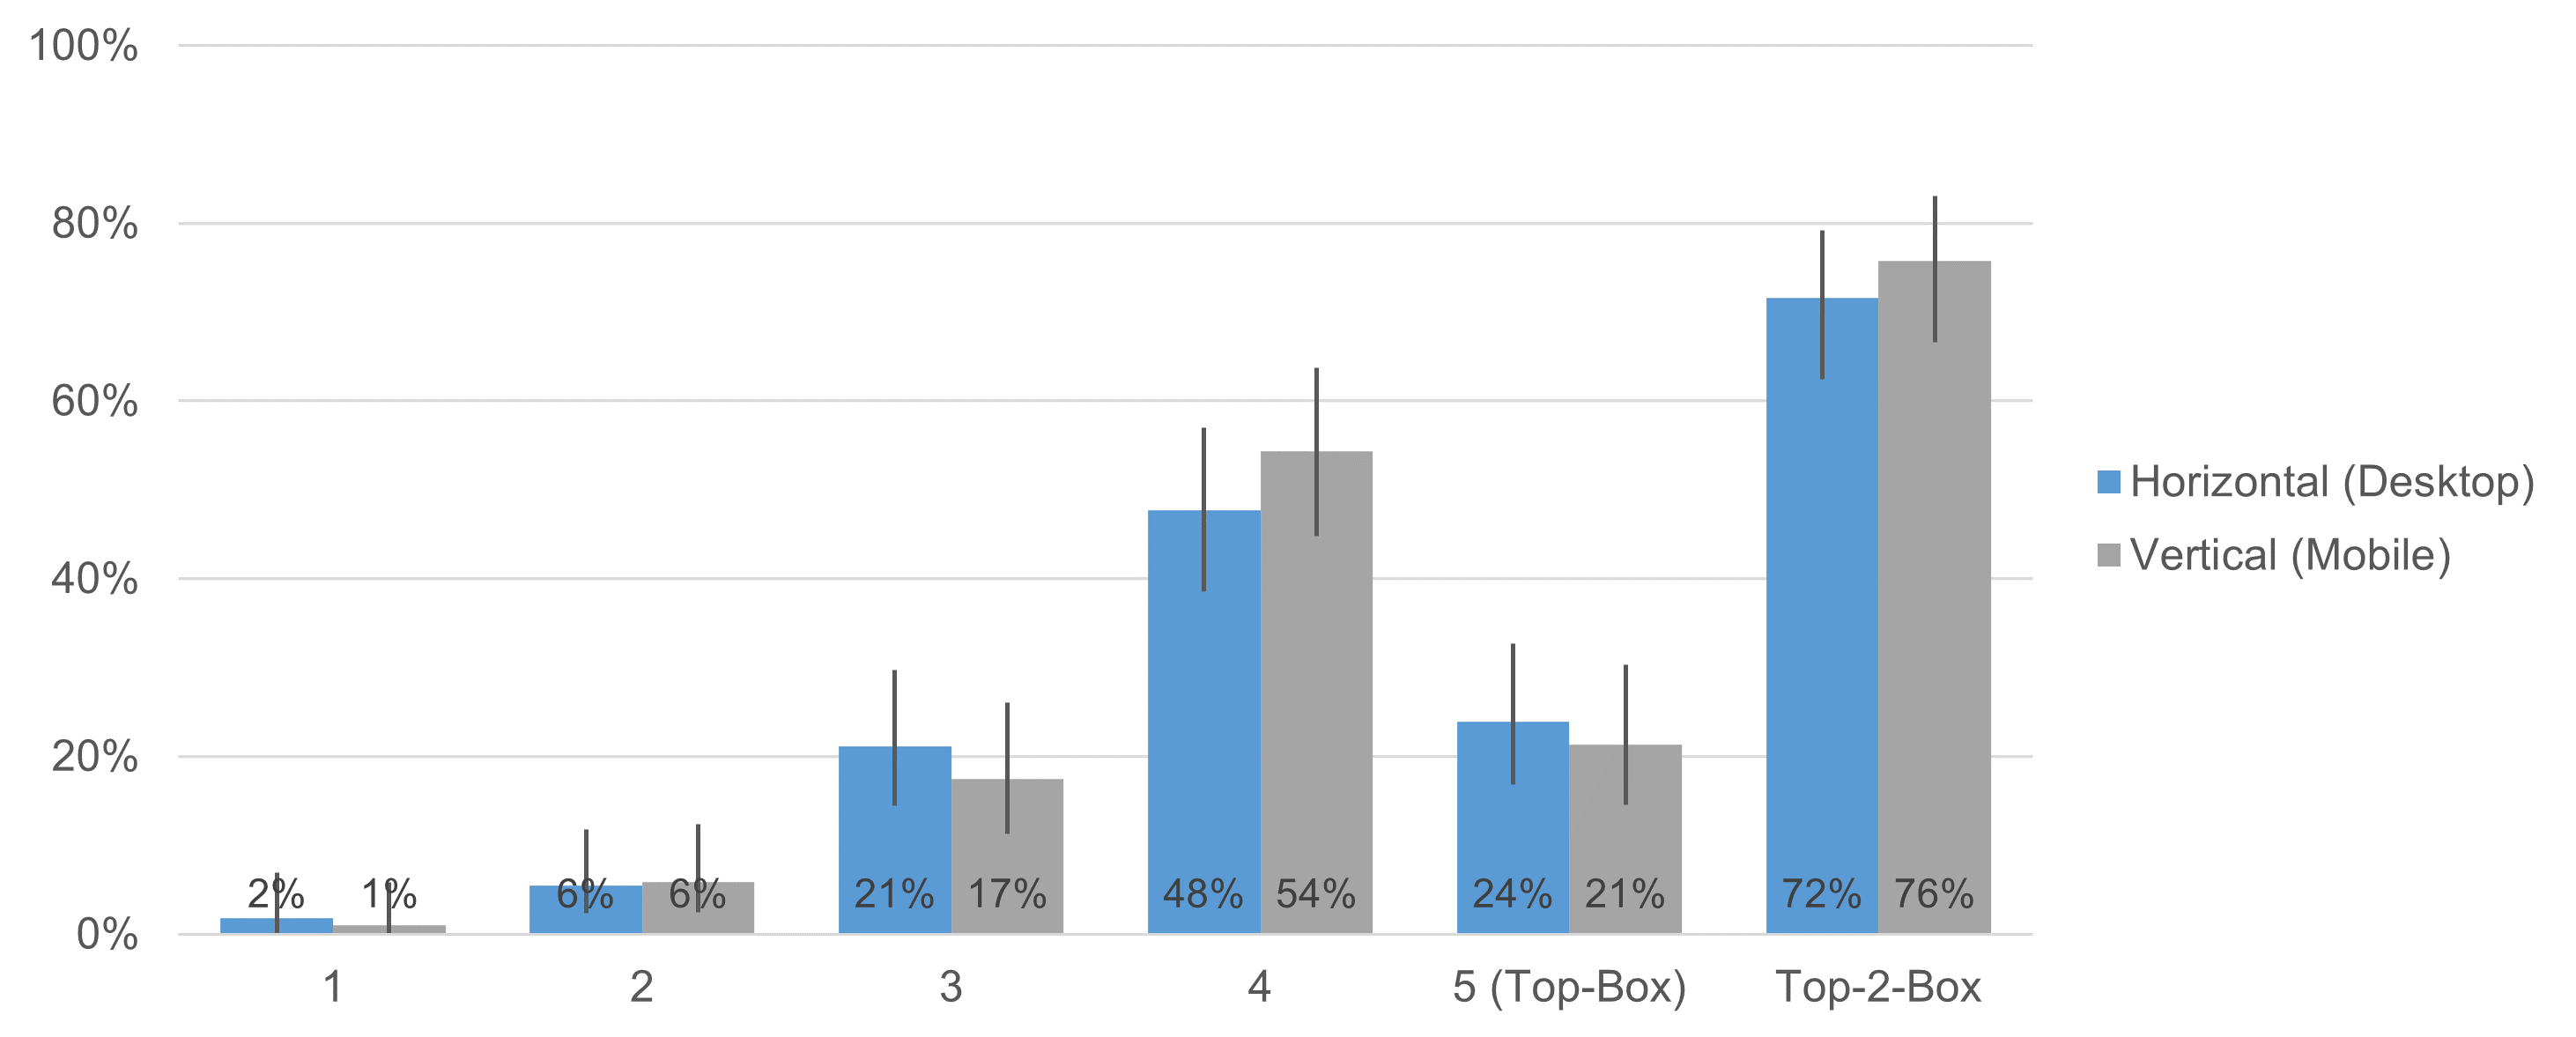
Figure 5: Response distributions of the UX-Lite Usefulness item for horizontal (desktop) and vertical (mobile) orientations (with 95% adjusted-Wald binary confidence intervals).
With one exception (Ease response option of 3), comparison of confidence intervals indicated no significant differences between desktop and mobile presentations. We conducted N-1 Two Proportion tests for the top-box and top-two-box scores (the most commonly used binary metrics for these types of scales) for each item. Table 1 shows the results of the four N-1 Two Proportion tests, all of which were nonsignificant (p-values from .13 to .81).
| Item | Metric | Z | p |
|---|---|---|---|
| Ease | Top-Box | 0.25 | 0.81 |
| Top-Two-Box | 1.5 | 0.13 | |
| Usefulness | Top-Box | 0.43 | 0.67 |
| Top-Two-Box | 0.69 | 0.49 |
Table 1: Results of N-1 Two Proportion tests on top-box and top-two-box scores for the UX-Lite Ease and Usefulness items.
Likelihood to Recommend (LTR: eleven-point scale)
Figure 6 shows the LTR means for the two experimental conditions. The difference was not statistically significant (t(210) = 0.80, p = .43), with an observed difference of 0.26 on a 0–10-point scale (95% confidence interval around the difference ranged from −.39 to .92).
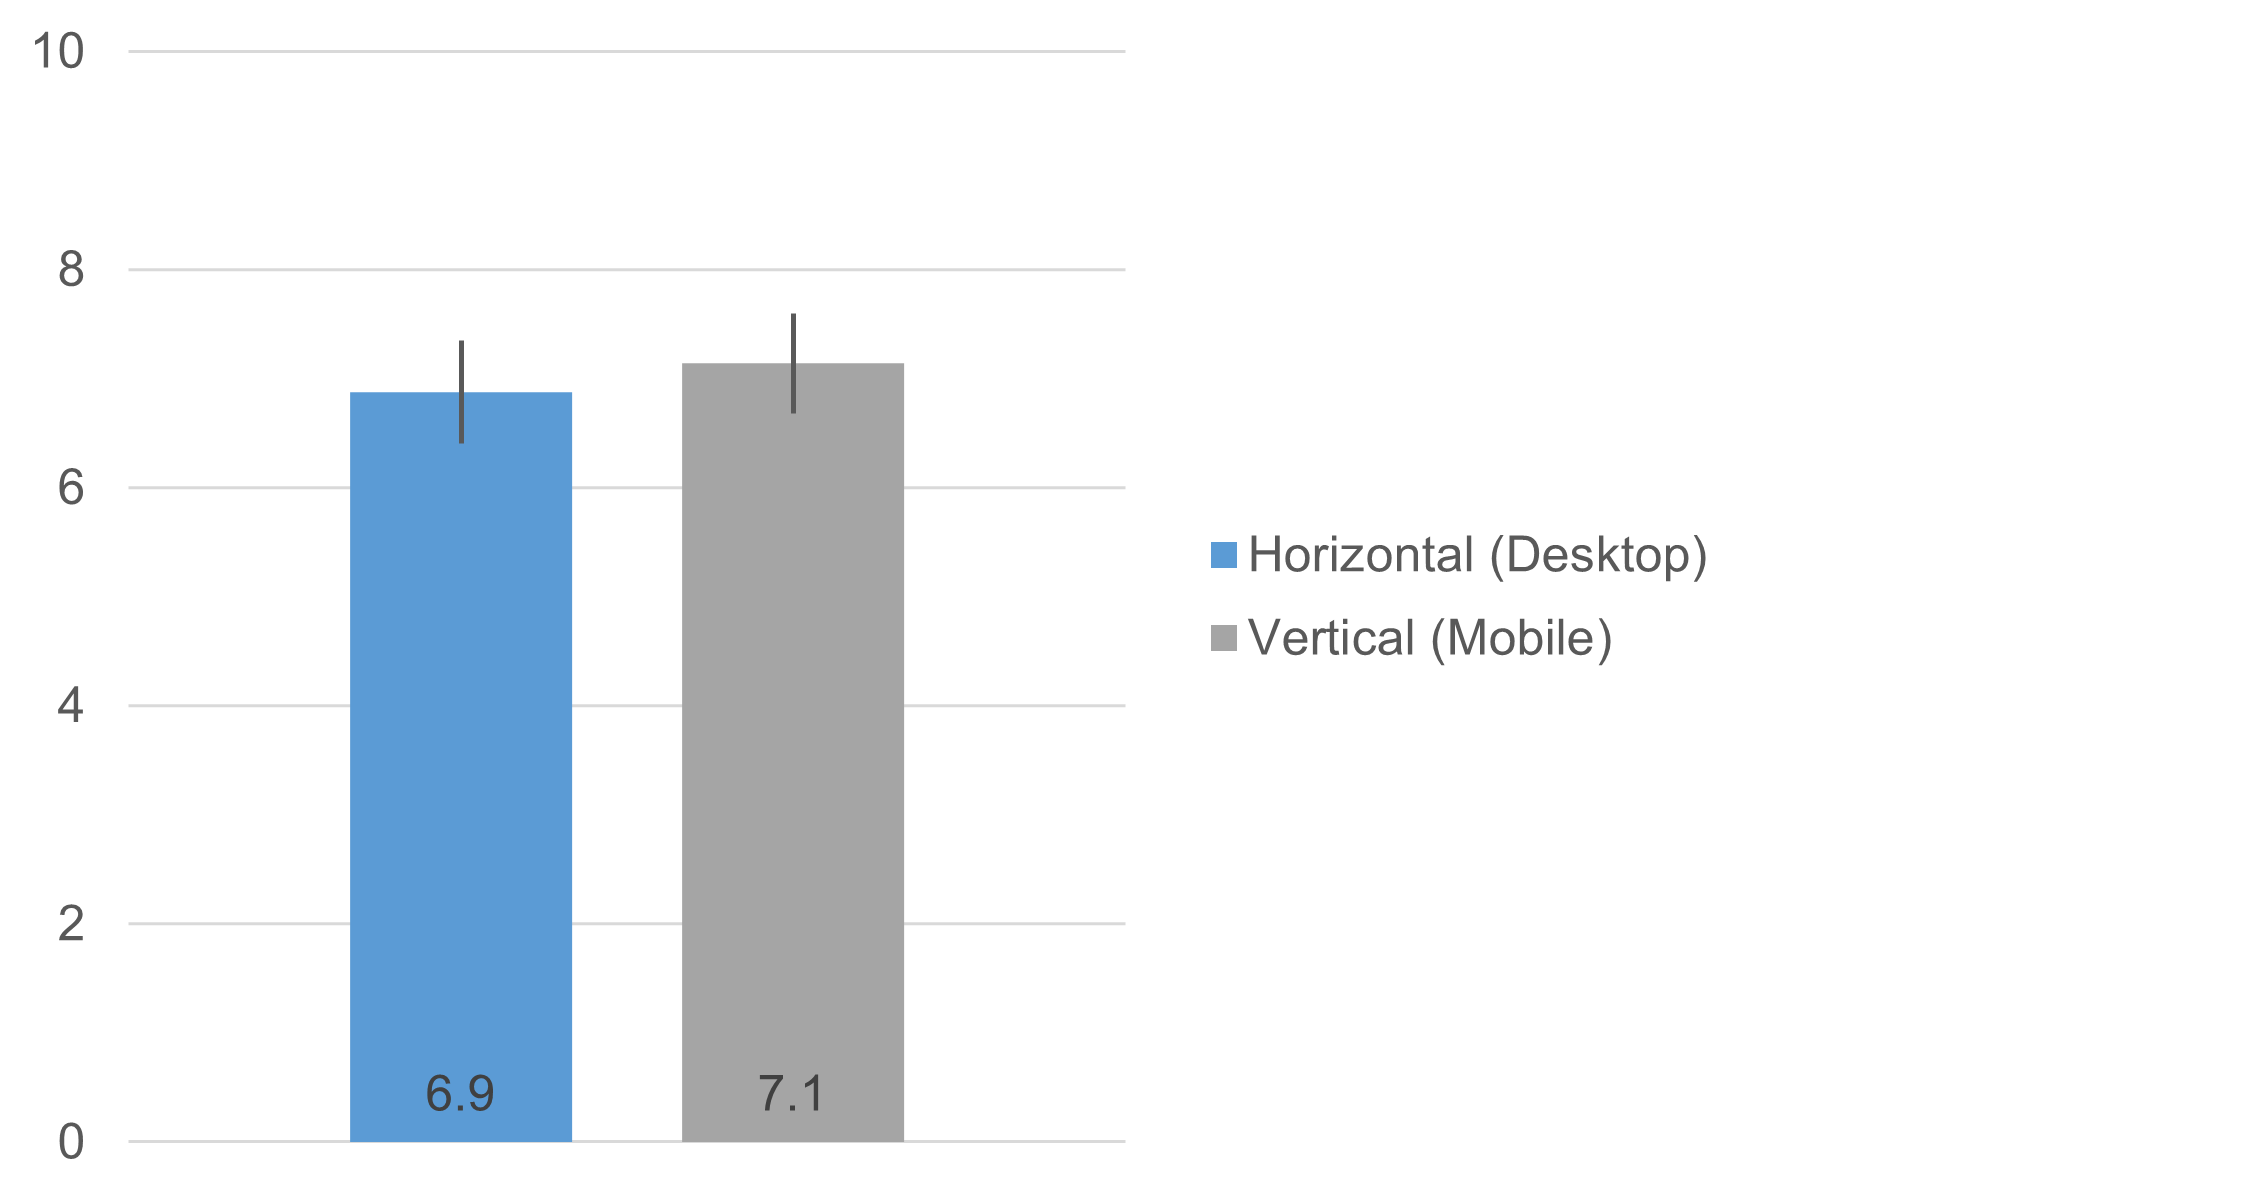
Figure 6: LTR means for horizontal (desktop) and vertical (mobile) orientations (with 95% confidence intervals).
Figure 7 shows the LTR response distributions.

Figure 7: Response distributions of the LTR item for horizontal (desktop) and vertical (mobile) orientations (with 95% adjusted-Wald binary confidence intervals).
The N-1 Two-Proportion tests of top-box (Z = 1.43, p = .15) and top-two-box (Z = 0.17, p = .86) scores were not statistically significant.
Because LTR can be used to compute Net Promoter Scores (NPS), we conducted a Z-test to assess the difference in NPS as a function of orientation (Figure 8).
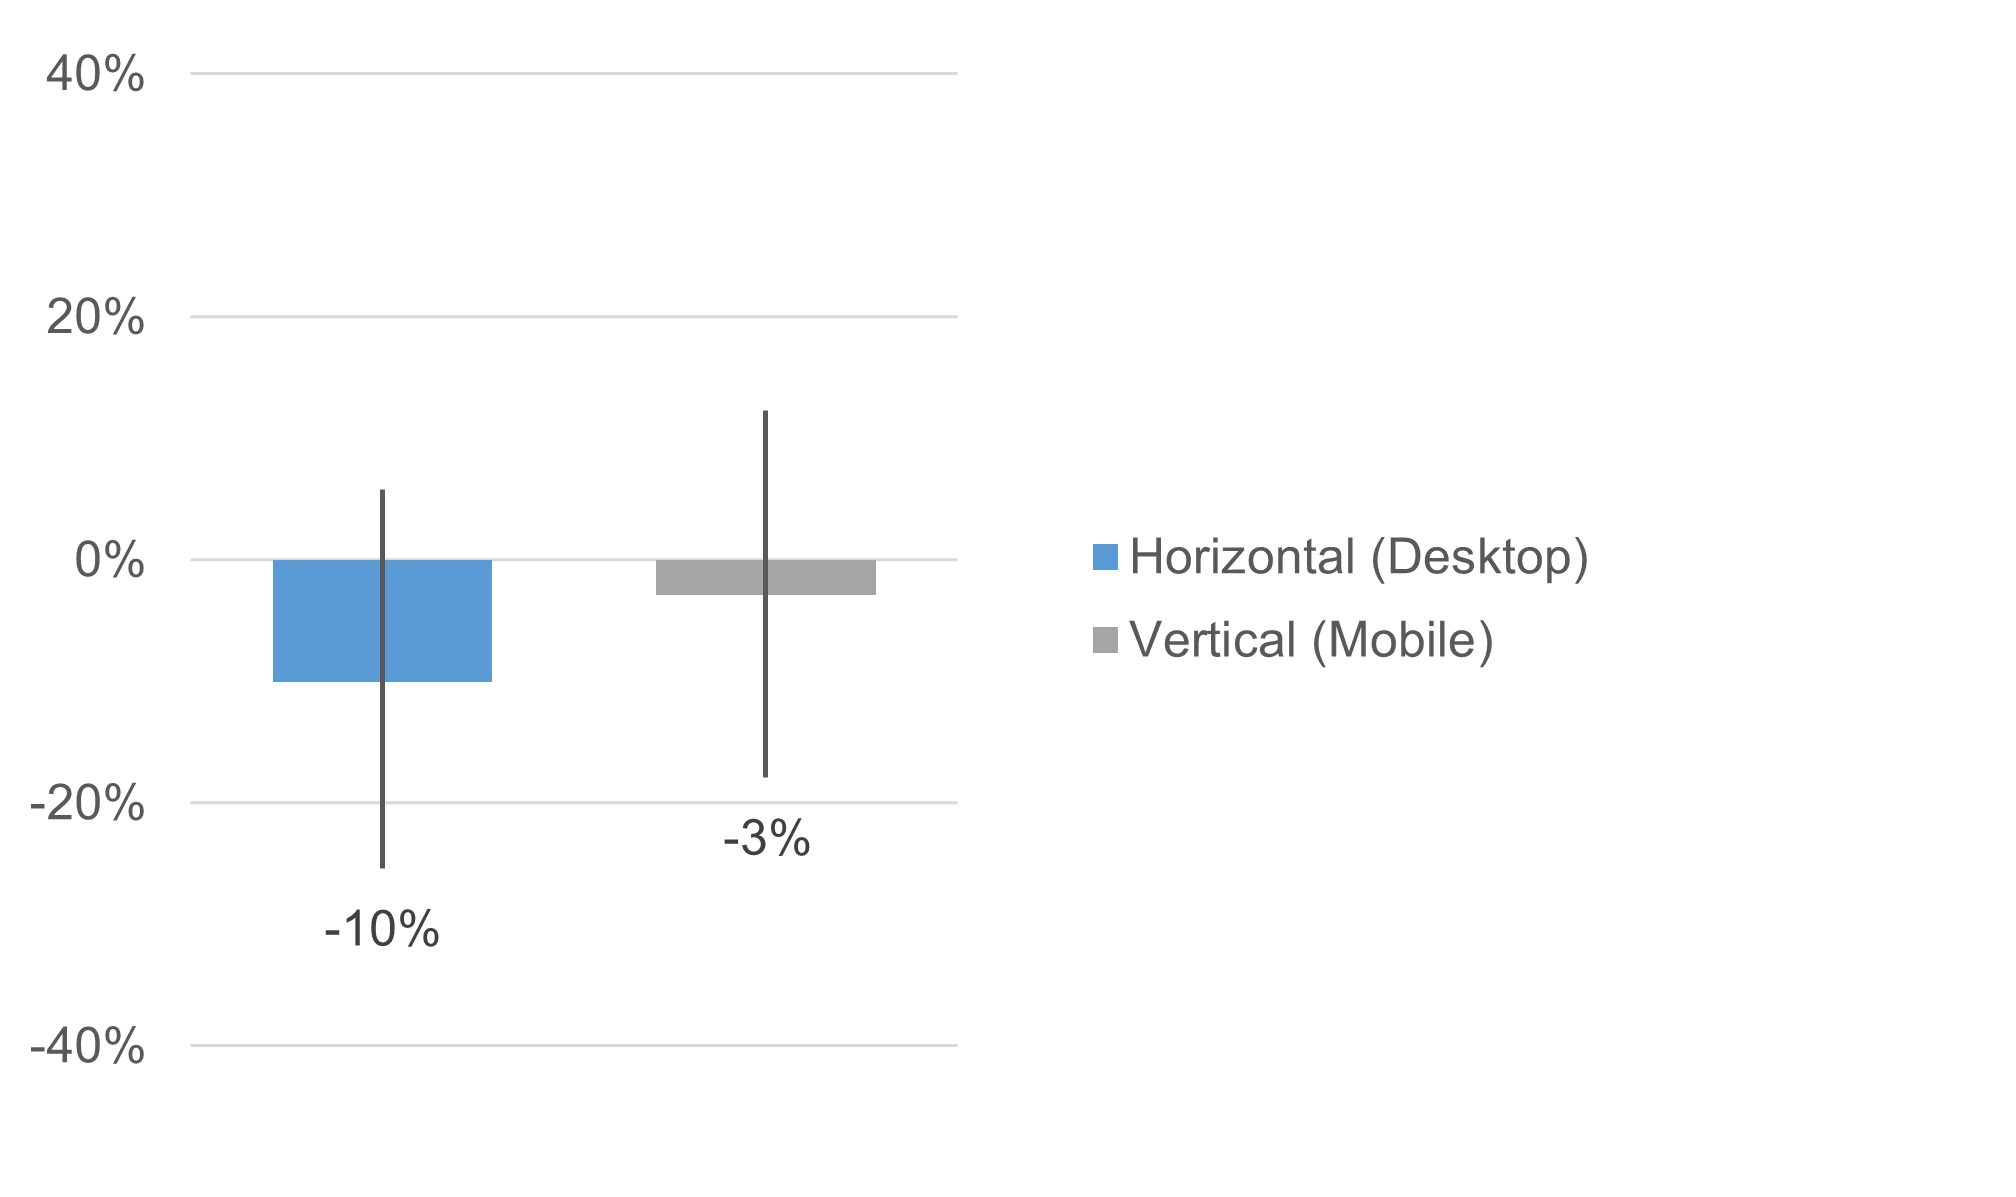
Figure 8: NPS for horizontal (desktop) and vertical (mobile) orientations (with 95% adjusted-Wald confidence intervals).
Both NPS were negative, indicating higher percentages of Detractors (ratings of 0–6) than Promoters (ratings of 9–10). The observed difference was 7 points on a 200-point scale (−100 to +100) and was not statistically significant (Z = 0.63, p = .53).
Summary and Discussion
Although scale orientation could have a large effect on rating behaviors, that does not appear to be the case; at least, any effects are inconsistent when looking at published literature and our own data.
Published studies have found no consistent effect. In a large-sample study reported in 2012 (n = 1505), Saunders et al. reported no differences attributable to scale orientation. Out of six items studied by Mockovak (2018), there was one statistically significant difference (higher rating with horizontal orientation). Out of six items studied by Friedman and Friedman (1994), there were three significant effects, but the direction of the effect was inconsistent.
Our study found no effects on overall scores. We assessed the effect of the combination of scale orientation (horizontal, vertical) and platform (desktop, mobile) on ratings of the UX-Lite and LTR (n = 212) using a Greco-Latin experimental design and found no significant difference in means for either metric (UX-Lite: p = .58; LTR: p = .43). We also found no significant differences in top-box or top-two-box scores (p-values from .13 to .86).
There were possible differences in distributions. There was no significant difference in the overall Net Promoter Scores based on orientation (p = .53). We did find three potentially significant differences for some of the pair-wise combinations (Ease 3, LTR 4, and LTR 9), but no apparent difference for the other 20 possible comparisons. These differences could be noise or a small effect that future research might establish, but the available distributional data do not indicate strong, consistent effects on rating behavior due to scale orientation.
Device with orientation could be a confounding factor. The experimental design we used was an incomplete factorial design because only desktop-using respondents saw the horizontal orientation, and only mobile-using respondents saw the vertical orientation. The shortcoming of this design is that we can’t differentiate the effects of device type from orientation. These are, however, the most common combinations used in online surveys, so it is important to know whether they promote different rating behaviors.
Large effects were ruled out (but there still might be small effects). Our sample size of 212, while not small, was not sufficiently large to produce precise enough measurements to justify practical acceptance of the null hypothesis. In other words, we can’t definitively say there is no effect of orientation.
For example, even though the mean UX-Lite difference was small (1.5 points), the 95% confidence interval around that difference ranged from −3.9 to 7.0. In other words, given this finding, a difference of 0 is plausible (therefore no statistically significant difference), but so is a difference as large as 7 points.
Considering these results and those from our literature review, we find no compelling evidence to support the hypothesis that there is a large difference in rating behavior due to scale orientation. It would, however, be premature to claim that there is essentially no difference due to orientation. Our data suggest that if there is a real difference, it is probably relatively small, especially when comparing means.


