 The UX-Lite® is an increasingly popular UX metric.
There’s a reason for its popularity. It’s a simple two-item questionnaire that measures perceptions of the user experience of any interface (product, app, website).
Its two five-point items are combined and scaled to generate an overall score and subscale scores on ease and usefulness from 0 to 100. The UX-Lite predicts future product usage as well as or better than the original (and longer) Technology Acceptance Model (TAM). The ease score also predicts the SUS with over 95% accuracy.
As with any UX metric, researchers should understand not only how to administer and score the metric but also how to generate sample size estimates.
Finding the right sample size estimate isn’t about picking a magic number. While there may be some magic ranges, the right process starts with the type of study design.
Three of the most common UX study designs are those with a focus on:
- Estimation (Confidence Interval/Margin of Error): The primary focus of this type of study is to get precise measurements of UX metrics. For example, a company might want to conduct a survey with the UX-Lite to get an initial assessment of how easy to use and useful users find a product. The primary analytical method for this study would be a confidence interval (average UX-Lite plus or minus its margin of error).
- Comparison with a benchmark: The word “benchmark” is used in different ways in UX research. In this context, we mean comparison with a benchmark value used as a criterion rather than comparisons of multiple products for high-level benchmarking. For example, a company might want to know if the UX-Lite score for their flagship product is above average, so they could compare their score to a benchmark of 78 (the lower bound of a grade of B on our standard grading scale for the UX-Lite). The primary analytical method for this study would be a t-test comparing the observed average to the benchmark criterion.
- Comparison of two means: These types of studies focus on comparing means in various contexts, including, for example, using the UX-Lite to compare competitive products or the same product measured over multiple points of time. There are different ways to analyze this type of data, but the most commonly used method is the t-test.
Across all three study types, a key ingredient is the historical standard deviation of the UX-Lite. Fortunately, we’ve collected enough data to have a good idea about a typical UX-Lite standard deviation.
In this article, we demonstrate how to compute the right sample size for UX-Lite confidence intervals by controlling the size of the margin of error (i.e., the desired level of precision).
UX-Lite Sample Sizes for Estimation (Confidence Intervals/Margins of Error)
A confidence interval is a statistical method for expressing the precision of measurement. The confidence interval is twice the margin of error.
The Elements of Sample Size Estimation for Confidence Intervals
To compute a sample size for a confidence interval, you need to know (Figure 1):
- An estimate of the standard deviation of measurement (s)
- The desired level of confidence (typically 90% or 95%)
- The desired margin of error (MoE) around the average (plus or minus)
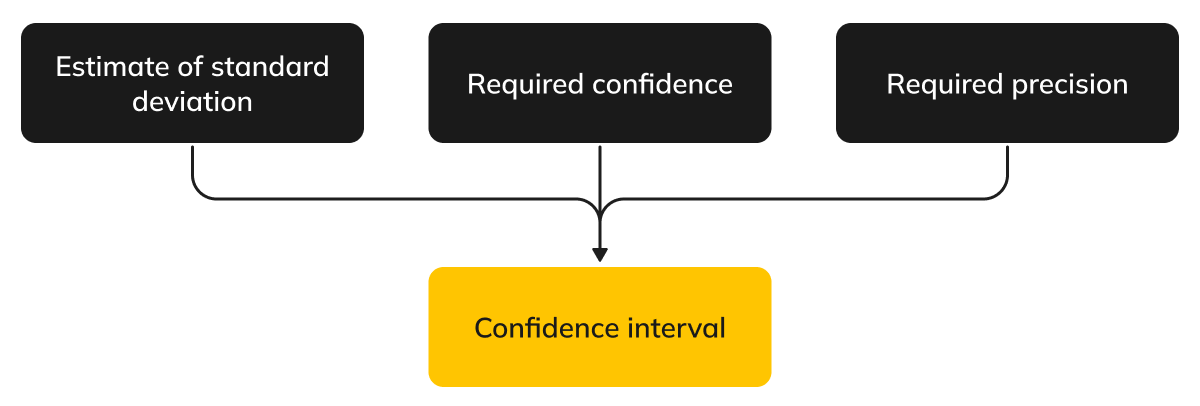
Figure 1: Drivers of sample size estimation for confidence intervals.
- Our best estimate of the standard deviation of the UX-Lite when averaged across individuals is 3, with an interquartile range from 16.6 (25th percentile) to 21.3 (75th percentile). This comes from our internal data collected over the years on many products, websites, and apps.
- In applied UX research, the confidence level is usually 90% or 95%.
- The final (and most influential) component is the desired margin of error that specifies how much uncertainty you can tolerate in your estimate. Realistic values for UX-Lite measurement are usually in the range from ±5 (reasonably precise) to ±10 (less precise but still able to distinguish between broad levels of acceptability).
With these three ingredients, we can now compute the sample size using the formula we walk through in Chapter 6 of our book Quantifying the User Experience and in the previous article on SUS sample sizes.
Sample Size Table for UX-Lite Confidence Intervals
Table 1 shows how variations in these three components affect sample size estimates for confidence intervals for the median standard deviation of 19.3 and for the 75th percentile of 21.3. In most cases, using the median standard deviation is reasonable, but when a sufficient sample size is more important than controlling the cost of sampling, it’s better to plan with the higher value.
| MoE | 90% | 95% | 90% | 95% | |
| 15 | 7 | 9 | 8 | 11 | |
| 10 | 13 | 17 | 15 | 20 | |
| 7.5 | 20 | 28 | 24 | 34 | |
| 5.0 | 43 | 60 | 51 | 73 | |
| 2.5 | 164 | 232 | 199 | 282 | |
| 2.0 | 254 | 361 | 309 | 439 | |
| 1.0 | 1010 | 1434 | 1230 | 1746 | |
Table 1: Sample size requirements for UX-Lite confidence intervals given various standard deviations (s), confidence levels, and margins of error (MoE), with green highlighting for the “magic range” in the table.
For example, if you need an interval to have 90% confidence assuming s = 19.3 and precision of ±15 (a very imprecise estimate), then you need a sample size of only 7. At the other end of the table, if you need 95% confidence assuming s = 21.3 and precision of ±1 (a very precise estimate), you’ll need a sample size of 1,746.
You can see a sort of Goldilocks zone or “magic range” for reasonably precise margins of error (MoE from ±2 to ±5), which have reasonably attainable sample size requirements (n from 43 to 439). The table also shows how sample size estimates balance statistics and logistics. The math for a high level of precision may indicate aiming for a sample size over 1,000, but the feasibility (cost and time) of obtaining that many participants might be prohibitive, even in a retrospective survey or unmoderated usability study. For all four columns in Table 1, moving the desired margin of error from ±2 to ±1 requires nearly quadrupling the sample size (a well-known inverse square relationship).
Technical Note: What to Do for Different Standard Deviations
If your historical UX-Lite data has a very different standard deviation from 19.3 or 21.3, you can do a quick computation to adjust the values in these tables. The first step is to compute a multiplier by dividing the new target variance (the square of the standard deviation, s2) by the variance used to create the table. Then multiply the tabled value of n by the multiplier and round it to get the revised estimate. To illustrate this, we’ll start with a standard deviation of 19.3 (our typical standard deviation) and show how this works if the target standard deviation (s) is 21.3 (our conservative estimate in Table 1). The target variability (21.32) is 453.69. The initial variability is 372.49 (19.32), making the multiplier 453.69/372.49 = 1.217. To use this multiplier to adjust the sample size for 95% confidence and precision of ±2.5 shown in Table 1 when s = 19.3, multiply 232 by 1.217 to get 282.344, then round it off to 282. For more information, see our article, “How Do Changes in Standard Deviation Affect Sample Size Estimation?“
Summary and Discussion
In this article, we described how to compute sample size requirements for UX-Lite scores in studies focused on estimation. Determining the right sample size is not about selecting a single “magic number,” but about matching statistical requirements to the goals of the study.
Sample Size Depends on Study Type
We distinguished three common UX study types that generate different sample size requirements: estimation, comparison with a benchmark, and comparison of two means. Each study type implies a different primary analytical method and, therefore, a different approach to sample size estimation. This article focused specifically on estimation studies, in which the primary analytical method is a confidence interval used to describe the precision of a UX-Lite score.
Estimation Requires Three Inputs
Computing a sample size for UX-Lite estimation requires three inputs:
- An estimate of the standard deviation: Based on accumulated UX-Lite data, we recommend generally using a standard deviation of 19.3 (but use a more conservative 21.3 when it’s critical to meet or exceed the precision goal of the study).
- The desired confidence level: In applied UX research, this is most commonly 90% or 95%.
- The desired margin of error (MoE): The margin of error specifies how much uncertainty can be tolerated in the estimate.
Precision Is Purchased with Sample Size
All other things being equal, setting a larger margin of error (less precise measurement) requires a smaller sample size, while setting a smaller margin of error (more precise measurement) requires a larger sample size. In other words, precision is purchased with sample size.
The table illustrates a practical planning range for UX-Lite estimation, with margins of error between ±2 and ±5 producing sample size requirements that are often feasible in retrospective surveys and unmoderated studies. They also illustrate the well-known inverse-square relationship between margin of error and sample size: reducing the margin of error by half requires approximately four times as many participants.
Adjusting for Different Standard Deviations
Because the variability of UX-Lite scores may differ across products and contexts, we also provided a straightforward method for adjusting the tabled sample sizes when the historical standard deviation differs from 19.3. By scaling sample sizes using the ratio of variances, researchers can quickly adapt the estimates to their own data while preserving the underlying statistical assumptions.
Bottom Line
There is no single “magic” sample size for UX-Lite studies. Effective sample size planning begins with the study goal, followed by explicit decisions about acceptable precision and practical constraints. The table and procedures presented here provide a consistent and defensible framework for making those decisions. For computational details, see Chapter 6 in Quantifying the User Experience or our previous article on estimating sample sizes for confidence intervals around SUS scores.


