 While task completion and task time are the default choices for measuring task effectiveness and task efficiency, the methods used to capture people’s feelings about an experience certainly seem more varied.
But after measuring post-task perceptions for decades, we’ve found that a simple seven-point item does a good job of capturing not only perceptions of ease but of other adjacent emotions as well.
The Single Ease Question (SEQ®) is a single seven-point question asked after participants attempt a task as part of a usability test or benchmark (Figure 1).
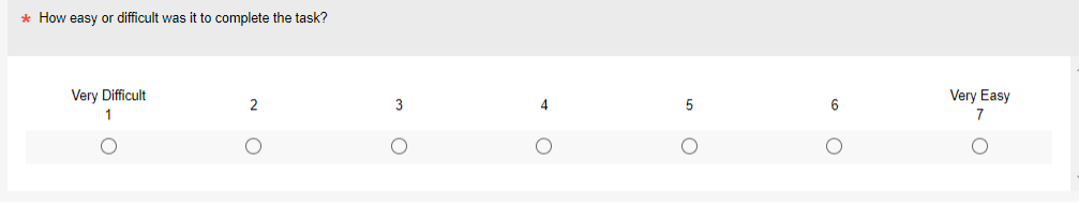
Figure 1: The SEQ (built into the MUiQ® platform).
The SEQ is probably the most popular measure of the perception of post-task ease, having over 600 citations since its publication in 2009. It has become a frequently used tool in the toolbox of many UX practitioners and researchers.
For this article, we dug into our historical data to explore the extent to which the SEQ correlates with other task metrics.
Satisfaction
In an analysis of six different sets of task data, we calculated 83 correlations between satisfaction and SEQ ratings collected from 1,768 participants across 21 unique products. Using each individual’s ratings, the correlation between satisfaction and ease was .71 (95% confidence interval from .69 to .73, 50% shared variance). When using means across tasks at the product level, the correlation was even higher (r = .91, 95% confidence from .83 to .99, 83% shared variance).
NASA Task Load Index (TLX)
The NASA TLX is a six-item questionnaire designed to measure perceived workload (mental and physical). Although we rarely investigate tasks where workload is a primary metric, in one study with ten participants, we collected the SEQ alongside the TLX and found the average correlation was quite strong for the overall measure (r = −.89, 95% confidence interval from −1.0 to −.74, 79% shared variance) and for the six dimensions (r = −.57 to r = −.95, 95% confidence intervals from −1.00 to −.07 and −1.00 to −.88, shared variance from 32% to 90%), suggesting good convergent validity.
Tapping
Tapping during task performance has been proposed as a real-time measure of cognitive load. Across two lab-based experiments with 28 participants, we compared tapping with SEQ scores across tasks and found a correlation of r = −.40 (95% confidence interval from −.73 to −.07, shared variance of 16%). A correlation of −.40 indicates about 16% shared variance for the metrics, leaving 84% unaccounted for, so SEQ scores don’t completely replace the information obtained from tapping. On the other hand, the relationship is high enough to consider using SEQ as a proxy for cognitive load when a measurement of tapping is not essential for the research questions.
Lostness
Lostness is a measure of how a user navigates an interface (usually a website) relative to the most efficient (“happy”) path. One way to measure lostness is by the ratio of unique pages relative to the minimum number of pages and the total number of pages relative to the unique number of pages.
However, computing this lostness measure is time consuming as it requires identifying the minimum number of pages or steps needed to complete a task, as well as counting all screens and the number of unique screens.
After analyzing 73 users who attempted eight tasks across three products, we found that the correlation between SEQ and lostness is high at the individual level (r = −.52, 95% confidence interval from −.69 to −.35, 27% shared variability) and very high at the task level (r = −.95, 95% confidence interval from −.86 to −1.00, 90% shared variance).
Completion Rates
The SEQ and completion rates correlate strongly at the task level (r = .66, 95% confidence interval from .59 to .73, 44% shared variance). This strong relationship (Figure 2) shows that participants’ thoughts about a task generally correspond to what actually happened (but not perfectly, similar to what we found with SUS scores).
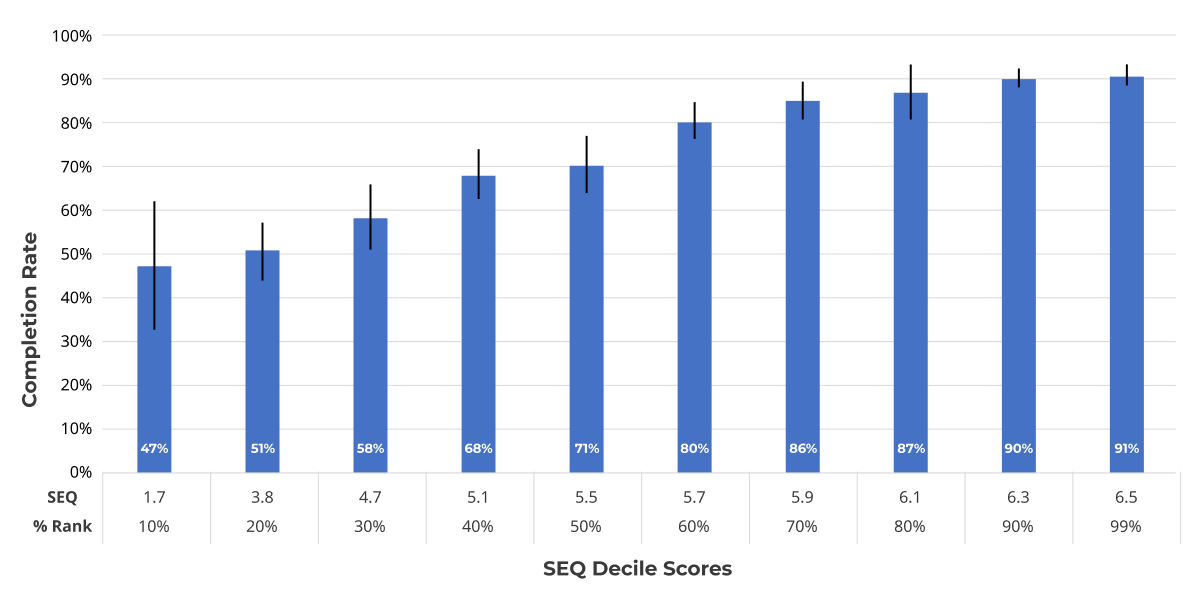
Figure 2: Relationship between SEQ scores (converted to deciles) and completion rates for 286 moderated and unmoderated tasks (collected from 2014 to 2018 with sample sizes from eight to 601 participants).
Task Completion Time
Using the same dataset as the completion rate data, we looked at the relationship between SEQ and concurrently collected task times from 270 tasks (Figure 3). Sample sizes were between 8 and 601. The task times were for all participants, whether or not the task was completed successfully. We found a strong correlation (r = −.53, 95% confidence interval from −.61 to −.45, 28% shared variance) between SEQ and the logarithm of task times (as tasks take longer, people’s perception of ease goes down). This means that perception of ease (SEQ scores) can explain about 28% of the variation in log task times.

Figure 3: Relationship between SEQ scores (converted to deciles) and completion times for 286 moderated and unmoderated tasks (collected from 2014 to 2018 with sample sizes from eight to 601 participants).
Mental Effort
The Subject Mental Effort Questionnaire (SMEQ) is a validated tool used to measure the perceived effort of a task. It was originally developed in the Netherlands in the 1990s, but it hasn’t been used much. However, it has some unusual characteristics that make it an interesting measure: (1) the response ranges from 0 to 150; (2) nine of the interior points (but neither endpoint) are labeled; (3) the intervals between labels are unequal.
In several studies comparing the SMEQ and SEQ, we have found consistently strong correlations (averaged across five tasks, r = .8, 95% confidence interval from .30 to 1.0, 64% shared variance) between variations of the SMEQ and SEQ, consistent with the expectation that there should be a relationship between perceived ease and perceived mental effort.
Relationship of SEQ with ASQ, Errors, and CES
In the previous sections, we’ve discussed the correlation of the SEQ with seven other task metrics.
This section describes the relationship of the SEQ with three other metrics for which we do not have precise quantitative correlations: the After-Scenario Questionnaire (ASQ), task errors, and the Customer Effort Score (CES).
ASQ
The ASQ was developed in 1988 as part of an IBM Research usability metrics project. It has three seven-point items measuring satisfaction with perceived ease, task duration, and support documentation. The item format of the ASQ is completely different from the standard SEQ (specifically, the ASQ has agreement endpoints, satisfaction-based wording, and a lower ASQ rating indicates a better experience). For comparison with Figure 1, the wording of the ASQ ease item is, “Overall, I am satisfied with the ease of completing the tasks in this scenario” (with seven numbered response options, 1 anchored with Strongly Agree and 7 with Strongly Disagree).
Due to their similarity, we’ve never concurrently collected the ASQ ease item and the SEQ. However, when we compared two versions of the SEQ that differed in endpoint polarity (manipulating the left/right location of Very Difficult and Very Easy), we found no evidence for a left-side bias, no significant difference in means, and overall no significant difference in top-box scores. We also found no statistically significant differences for SEQ versions with slightly different item stems.
So, we strongly suspect that respondent behaviors with the SEQ and the ease item of the ASQ would be almost identical.
Task Errors
The key task metrics for usability studies are successful task completion, task completion time, and subjective ratings of constructs like perceived ease (e.g., the SEQ). A less commonly reported task metric is the number of errors committed by participants.
We do not have any recent data with concurrently collected SEQ ratings and error counts. In 2009, however, we published analyses of data from 90 anonymized usability studies contributed by numerous UX practitioners (Jeff at MeasuringU, Jim at IBM, and many others for a total of 1,034 unique tasks). The studies contributed by Jeff included early versions of the SEQ, those contributed by Jim included the ASQ, and those contributed by others were not identical, but all were subjective task ratings. Our best estimate of the correlation between task satisfaction (e.g., SEQ, ASQ, and other subjective ratings) and the number of errors was r = −.44 (95% confidence interval from −.77 to −.11, 19% shared variance).
We don’t have a good estimate of the specific correlation between SEQ and task errors, but we expect it would not be radically different from the correlation of −.44 we published in 2009.
Customer Effort Score (CES)
The CES is a single item developed for customers to rate how easy it was to interact with an organization in the context of a support issue—a specialized, real-world task. From its first to second versions, the scale evolved from a five-point item-specific scale (with endpoints from Very Low Effort to Very High Effort) to a fully labeled seven-point agreement scale (specifically, “The organization made it easy for me to handle my issue” with endpoints from 1: Strongly Disagree to 7: Strongly Agree).
It’s often cited as a good alternative to the Net Promoter Score (NPS) despite little data to support this claim. Also, its wording makes it much less generalizable than the NPS, as many customers don’t contact support. We aren’t aware of solid published benchmarks on the CES beyond its original publication and some general advice.
We don’t have correlational data for the SEQ and CES, but we would expect a high correlation because the wording and construction of the CES are so similar to the SEQ (seven-point scales assessing task ease with 1 the poorest and 7 the best rating). We’ve tested many variations of SEQ wording/formats and found little difference in means and consistently high correlations. We’ve also seen little impact when scales are changed from item-specific to agreement formats.
The current manifestation of the CES so closely resembles the SEQ that they’re hard to differentiate (the ease of handling an issue is akin to the ease of completing a task). Because the SEQ is likely to be a good proxy for the CES, our SEQ benchmarks may be helpful for interpreting the CES.
From an experiment in which we manipulated task difficulty and had respondents rate their experience with the SEQ (standard seven-point version) and an adjective scale, we got the following results (range of SEQ means associated with the adjective scale):
1.00–1.49: Most difficult imaginable
1.50–2.69: Very difficult
2.70–4.29: Difficult
4.30–5.59: Easy
5.60–6.49: Very easy
6.50–7.00: Easiest imaginable
Note that our empirically estimated boundaries for the response options of the adjective scale are similar to published heuristics (not empirically validated) for interpreting the CES. For example, a recent online source (Intellicon) recommended interpreting scores below 3.5 as poor, 3.5–4.4 as below average, 4.5–5.4 as average, 5.5–6.4 as good, and 6.5–7.0 as Excellent.
Summary
The SEQ is popular because it’s short and often provides concurrent validity for other UX metrics. When correlations are high, it can also act as a proxy for other measures, especially those that are challenging to collect in typical UX research contexts. Table 1 summarizes the correlations between the SEQ and other task-level measures.
| Metric | Level | Correlation (r) | Shared Variance (R2) |
|---|---|---|---|
| Satisfaction | Individual | 0.71 | 50% |
| Product | 0.91 | 83% | |
| NASA TLX | Task | −0.89 | 79% |
| Tapping | Individual | −0.40 | 16% |
| Lostness | Individual | −0.52 | 27% |
| Task | −0.95 | 90% | |
| Completion | Task | 0.66 | 44% |
| Time | Task | −0.53 | 28% |
| SMEQ | Task | 0.80 | 64% |
Table 1: Summary of SEQ and other task-level metrics (due to reduced variability, correlations at task and product levels tend to be higher than at the individual level, all correlations statistically significant with p < .05).