 Should you use the Net Promoter Score? Maybe, maybe not.
We’re not here to debate whether you should use it or not (and you may not have a choice). Instead, we want to use data (rather than opinions) to review and grade 13 claims made about the NPS, some from NPS critics and others from NPS proponents. At the end, we give a report card on how well these claims stand up against the evidence.
NPS Background (If You Need It)
If you are somehow not familiar with the NPS, here’s some quick background. It was introduced in 2003 by Fred Reichheld in a Harvard Business Review article, “The One Number You Need to Grow.” The NPS is computed from multiple responses to one question about likelihood to recommend (LTR, Figure 1), usually followed by an open-ended question in which respondents can discuss the reason for their ratings because, on their own, measures of behavioral intention like the LTR cannot diagnose specific problems (and no one has ever credibly claimed that they can).
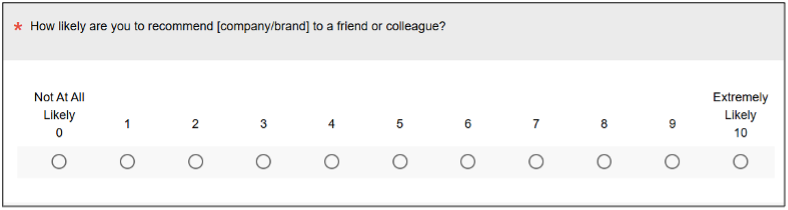
Figure 1: The likelihood-to-recommend (LTR) rating that is the basis of the Net Promoter Score (NPS).
In NPS terminology, respondents who select 9 or 10 on the LTR question are Promoters, those who select 0 through 6 are Detractors, and all others are Passives. The NPS is the percentage of Promoters minus the percentage of Detractors (the “net” in “Net Promoter”). So, while we often use “LTR” and “NPS” interchangeably, there’s a subtle difference when doing analysis (LTR is an eleven-point rating scale, NPS is a trinomial derived from LTR ratings).
A substantial number of Fortune 500 companies use the NPS and even report on it in their earnings calls. The NPS is ubiquitous, with some saying it has a cult-like following among CEOs.
It’s also developed an anti-cult, with some calling its use harmful. We have extensively reviewed the published literature and have conducted a lot of our own analyses to generate data to sift through the noise and bluster. We discussed many of these findings in our three-part course on the Net Promoter Score.
Here are 13 claims that we’ve examined using published data and our own analyses:
- NPS is predictive of future company growth.
- NPS is a consistently better predictor of growth than satisfaction.
- NPS is a reliable metric.
- NPS’ net-box scoring method can be justified.
- Promoters actually recommend.
- Detractors actually detract.
- The LTR item has an appropriate number of points.
- A single item is sufficient for measuring the NPS.
- Measuring future recommendation instead of past behavior is better.
- NPS predicts likelihood to discourage.
- NPS should always be used.
- NPS should never be used.
- NPS has no value because it doesn’t tell you what to fix.
Now to the grades.
NPS is predictive of future company growth (C+)
The title “The One Number You Need to Grow” is a strong claim, but it’s common practice in business journals to write such titles to draw attention to an article; any caveats, exceptions, or other nuances appear in the body of the article. To support that claim, Reichheld reported that the NPS was the best or second-best predictor of growth in 11 of 14 industries. Others have challenged that claim.
In 2018, we revisited the data Reichheld used to support the claim that NPS was predictive of company growth. Reichheld had actually demonstrated a correlation between the NPS and past growth rates, so for this replication, we tracked down data from seven industries that Reichheld had cited in his 2003 HBR article and 2006 book The Ultimate Question. The resulting regression models did corroborate Reichheld’s findings, with the NPS accounting for a substantial 38% of the changes in growth for the seven industries for the following two years and 30% for the following four years. But were those seven industries cherry-picked?
In our second study, we increased the number of industries to 14 (with 158 companies), deliberately excluding the industries reported by Reichheld. For that expanded dataset, the relationship between NPS and future company growth was weaker but still significant, accounting for 12% (r = .35) of change in growth over two years and 10% (r = .31) over four years.
This line of research has shown a strong correlation between NPS and historical revenue and a modest ability to predict immediate and distant future growth that is stronger in some industries than others. These findings do not support claims that the NPS has no predictive value. It’s not a perfect predictor (no measure is), but it’s also not a perfectly useless one.
Overall, our grade for the claim that the NPS is predictive of future company growth is C+.
NPS is a consistently better predictor of growth than satisfaction (D)
Satisfaction and behavioral intentions are theoretically different. Satisfaction is a feeling, while NPS is based on the behavioral intention to recommend. Satisfaction is the spark, while behavioral intention is the flame. One ignites the other, but they’re distinct. Without the spark of a positive feeling, there’s no fire to recommend. Nonetheless, in the space of high-stakes competition among consulting companies that promote different metrics, Reichheld made it a point to claim that the NPS is better than satisfaction at predicting company growth despite a long research history showing that satisfaction is linked to future business outcomes, including customer retention and share of wallet. For example, Reichheld wrote:
Our research indicates that satisfaction lacks a consistently demonstrable connection to actual customer behavior and growth.
It is difficult to discern a strong correlation between high customer satisfaction scores and outstanding sales growth.
Broad analyses of the relationship between feelings and behavior usually find modest correlations around .35, while correlations between intentions and behaviors tend to be a bit stronger (around r = .50). But is the relationship between the NPS and behavior consistently stronger than the one between satisfaction and behavior (as measured with business metrics)?
NPS and satisfaction scores are typically highly correlated (averaging around .83), so you would expect only a modest difference between how NPS and satisfaction correlate with the same outcome variable.
And, indeed, that’s what we found in our extensive analysis. Returning to the expanded dataset we collected with NPS and growth numbers for 14 industries and 158 companies, satisfaction data from the American Customer Satisfaction Index (ACSI) was available for 71 companies from 12 industries. For seven of those industries, the NPS had a higher correlation with growth than satisfaction, and for the other five, the reverse was the case.
As you’d expect from their strong correlation, the NPS is not a consistently better predictor of growth than satisfaction, so the grade for this claim is D. (It would have been F if the NPS were consistently worse or A if the NPS were always better.) In practice, it looks like it probably doesn’t matter much which of these two metrics a business uses, and there doesn’t seem to be any obvious upside for a business to change from one to the other.
NPS is a reliable metric (A)
Statistical reliability assesses the consistency of measurement. To estimate the test-retest reliability of the NPS, we conducted an experiment in multiple phases. First, 2,529 U.S.-based online respondents rated their experiences (including brand attitude, satisfaction, and LTR) with one of a selected set of top 50 brands. In the second phase, participants received the same survey from 17 to 47 days later; a final sample size of 259 responded to both surveys. The correlation between the first and second LTR ratings was .75 (with a nonsignificant change in means of just 1.2%). There is little consensus on what constitutes “adequate” or “good” test-retest reliability, but a common criterion for an acceptable level of reliability is .70. With that threshold, the NPS performs well.
Our grade for the claim of acceptable NPS reliability is A.
NPS’ net-box scoring method can be justified (A−)
Despite some criticism that no evidence supports the NPS practice of designating LTR responses from 0 to 6 as detractors, 7–8 as passives, and 9–10 as promoters, Reichheld explained in the 2003 HBR article:
When we examined customer referral and repurchase behaviors along this [0–10-point] scale, we found three logical clusters. “Promoters,” the customers with the highest rates of repurchase and referral, gave ratings of nine or ten to the question. The “passively satisfied” logged a seven or an eight, and “detractors” scored from zero to six.
Specifically, Reichheld has reported that respondents designated as detractors produced 80% of the total negative word-of-mouth comments, and those designated as promoters provided 80% of referrals.
Reichheld described the computation of the NPS as subtracting the percentage of detractors from the percentage of promoters without explicit justification. Is this scoring method better than using means? We’re not so sure, but it is, however, common practice in business analysis to use these types of net-box scores, where it’s deemed acceptable to give up some information in the LTR to focus on the extreme ratings because they are often better predictors of future behavior. Importantly, in our earlier analysis of NPS predicting future growth, we did use the net-box scoring, and it performed as well or better than satisfaction ratings using means.
Because they provide different types of information, we recommend tracking both the NPS and the mean LTR.
Our grade for the claim that the NPS box scoring method is justified is A−.
Promoters actually recommend (A)
We conducted a longitudinal study to see whether we could replicate Reichheld’s estimate that promoters provide about 80% of referrals. We asked participants from an online U.S. panel to rate their likelihood to recommend several common brands (n = 6,026), their most recent purchase (n = 4,686), and their most recently recommended company/product (n = 2,763) using the eleven-point LTR item (between 502 and 1,027 LTR ratings per brand).
We followed up with a second survey at 30, 60, and 90 days with similar brand lists, asking which, if any, respondents had recommended during that time. About 28% of all respondents reported recommending, with 51% of the recommendations coming from promoters. Promoters accounted for 77% of recommendations from the most recently recommended product and 60% for the most recent purchase. Promoters were between 2 and 16 times more likely to recommend than detractors. Our estimates of the percentage of recommendations coming from promoters were lower than Reichheld’s 80%, but not that much lower (51% to 77%). We believe some of the confusion around this claim comes from a belief that most promoters recommend—often, only around 25% do. Rather, when people do recommend, they are much more likely to be promoters.
Our grade for the claim that promoters are more likely to recommend is A.
Detractors actually detract (A)
We now move to the detractors at the low end of the LTR scale. To investigate Reichheld’s claim that 80% of negative word-of-mouth comes from detractors, we consulted about 500 U.S. customers, who provided LTR ratings and open-ended comments regarding their most recent experiences with one of nine prominent brands and products. Of 452 comments collected in the study, 39% were positive and 21% were negative.
About 24% of negative comments came from people who selected 0 on the LTR. In contrast, 35% of positive comments came from people who gave an LTR rating of 10. As the LTR increased from 0 to 10, the percentage of negative comments went down (r = −.71) and the percentage of positive comments went up (r = .87).
After applying the NPS classification scheme, 90% of negative came from detractors, while only 14% of negative comments came from promoters (Figure 2). We again think there is some confusion around this claim because it’s not that most detractors make bad comments or say bad things (14% of positive comments came from detractors). It’s that the people who do say bad things (negative word of mouth) are much more likely to be detractors.
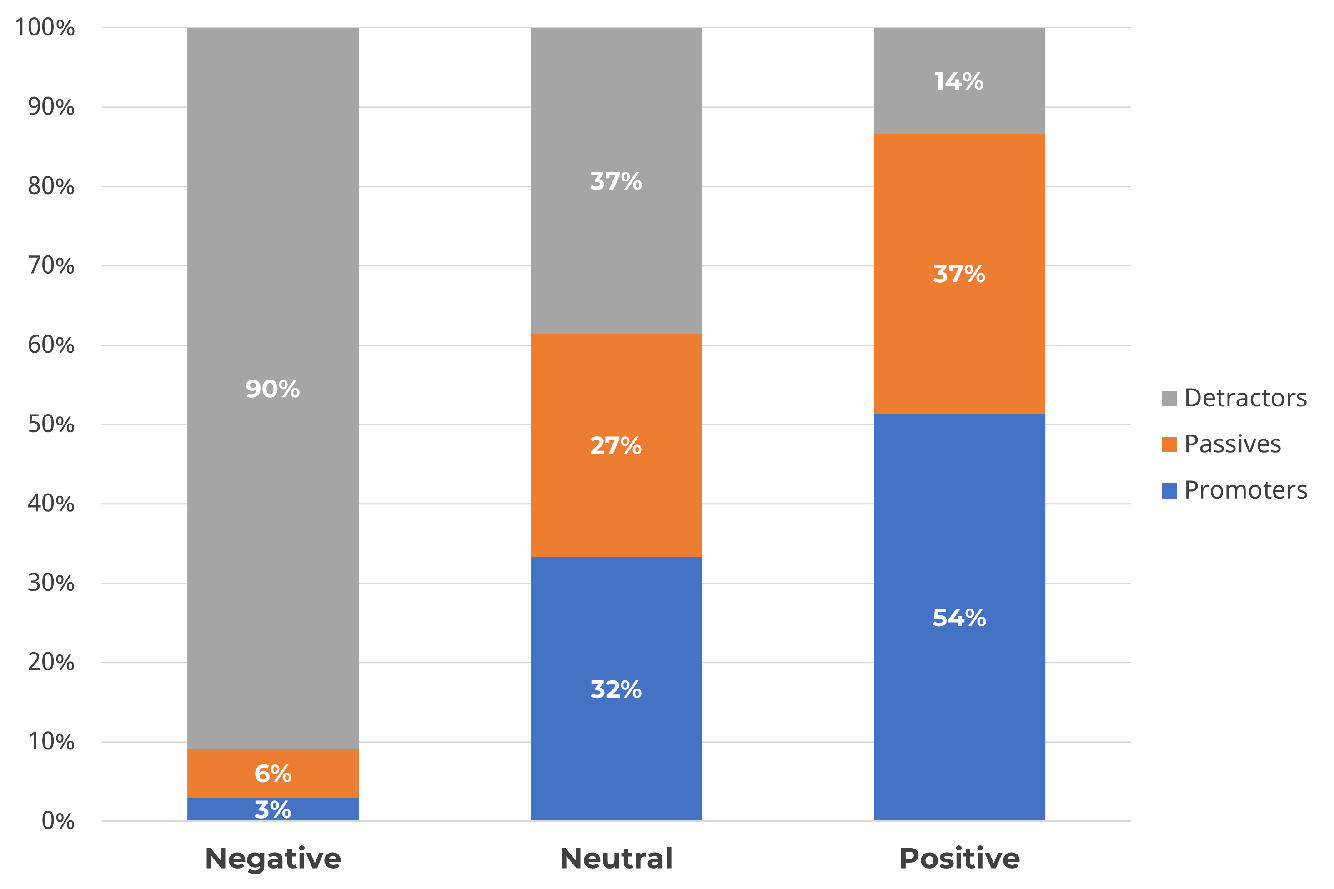
Figure 2: Percent of positive or negative comments associated with each NPS classification.
Our grade for the claim that detractors are more likely to detract is A.
The LTR item has an appropriate number of points (A)
The NPS has been criticized for using the eleven-point LTR scale and then converting those to three response categories (detractor, passive, promoter). Why not just ask people if they’d recommend, wouldn’t recommend, or are unsure? Or why not use a scale with fewer points?
The main problem with using a three-point scale is the loss of response intensity. With just three options, people are restricted to Yes, Maybe, and No. With eleven options in the NPS framework, people can indicate much finer gradations of intention than they could with just three options, from “NO!!!!” to “No” to “no” to “yes” to “Yes” to “YES!!!” As mentioned earlier, more extreme intentions are associated with a greater likelihood of action, so it’s important to capture the extremes.
When we tested three- and eleven-point versions of the LTR in a survey with 824 respondents, 63% rated three points as easier, but 81% rated eleven points as allowing them to express their feelings more adequately. Respondent behavior was very different when the LTR was three versus eleven points. For example, as shown in Figure 3, “Yes” clearly clusters near the top of the scale, but the eleven-point scale differentiated between the extreme “Yes” responders—53% selected 10, compared to the less extreme 9s (17%)—and more tepid 8s and 7s (11% and 9% respectively). The same is seen with the “No” respondents, who also selected 0 the most (43%), but there were quite a few less intense responses (26% selected between 1 and 4).
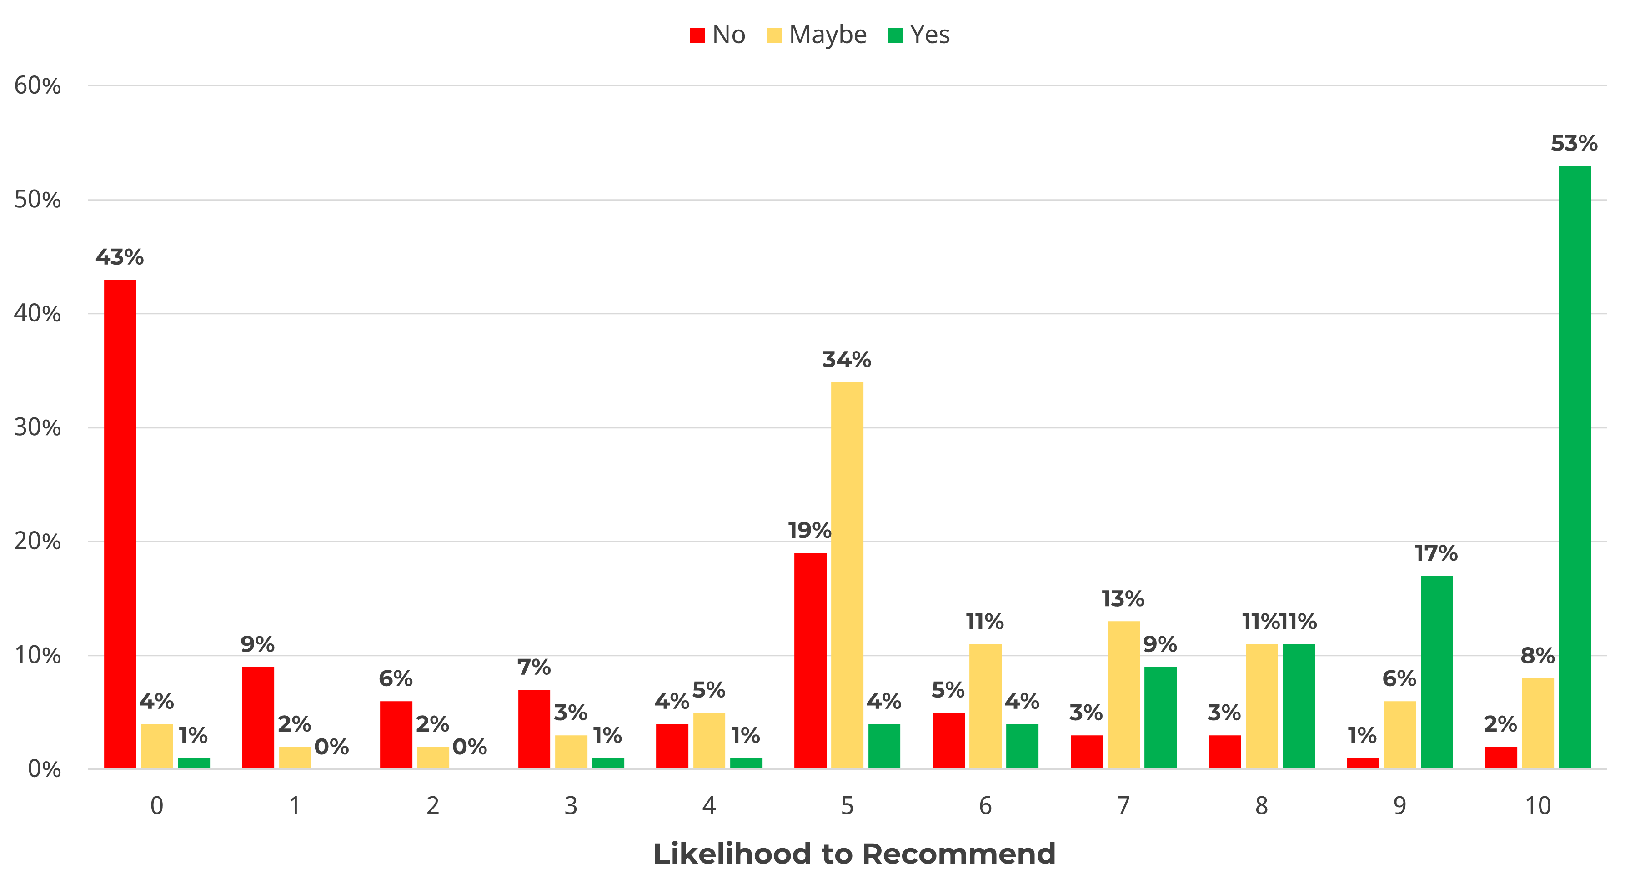
Figure 3: Distribution of how Yeses, Maybes, and Noes map to the eleven-point LTR item, showing not all Yeses are created equal, with more than half selecting 10 and 37% selecting 7, 8, and 9.
But what about using a five- or ten-point scale instead of the eleven-point scale? We also looked into those and found only modest differences among scores generated from five-, ten-, and eleven-point scales. We recommend using the eleven-point scale (for comparability to published benchmarks), but if you have historical data using a ten- or five-point version, you should probably stick with it. There’s little benefit in changing to an eleven-point version, but keep in mind your NPS scores will have some comparison error to benchmarks (our analysis suggested around +/− 4%).
Our grade for the claim that the LTR item has an appropriate number of points is A.
A single item is sufficient for measuring the NPS (A)
A typical practice in the development of standardized metrics is to have multiple items per construct because multi-item metrics tend to be more reliable (and it’s easier to measure their reliability). There are, however, numerous single-item metrics in use that work well. One way to increase the reliability of single-item metrics is to increase the number of response options, which is why single-item measures of behavioral intention (like LTR) often have seven to eleven points.
Some NPS critics suggest that a large number of response options is difficult to use or that people just won’t use the full range offered. When we’ve investigated actual respondent behavior with LTR, we’ve found no indication that respondents have trouble selecting a response from an eleven-point scale, are confused by the number of response options, or restrict the range of their selections.
Our grade for the claim that a single item is sufficient for measuring the NPS is A.
Measuring future recommendation instead of past behavior is better (A−)
Another common NPS criticism is the claim that it’s better to ask people what they’ve recently done rather than asking them what they intend to do in the future. After all, who can really accurately predict the future?
Even though it seems like past behavior should indicate a behavior that people habitually repeat and thus should be preferred instead of intentions that can be forgotten or thwarted, a literature review by Ouellette and Wood (1998) found that behavioral intentions (what people think they will do) were better predictors of future behavior (r = .54) than past behaviors (r = .39), especially when the behavior isn’t performed on a frequent basis.
In our own research (n = 2,672), where respondents were asked to give current LTR ratings of products they had recommended in the past, 8% indicated they would not recommend them in the future (usually due to a problem experienced with the product or lack of recommendation opportunity).
Our best estimate from the recommendation literature and our own research is that between 50% and 60% of promoters ultimately make recommendations (about three times the percentage of detractors who ultimately recommended).
Critics might take these percentages as more of a glass-half-empty indicator because not all who intend to recommend ultimately do so. However, it isn’t realistic to expect recommendation behavior to equal recommendation intention. Once someone expresses an intention to recommend, there are obstacles to actual recommendation, including never having an opportunity to recommend or not having a strong enough intention to exert the effort to recommend. A more positive framing of the key finding from these studies is that there is a strong relationship between the intensity of the intention to recommend and future recommendation behavior, so changes to the quality of UX and CX that affect likelihood to recommend are important.
That said, because questions about past recommendations and intention to recommend appear to be measuring different things, there may be value in including an item in surveys that asks about past recommendation behaviors. In other words, past recommendations are a complement, not a replacement, for future intent.
Our grade for the claim that measuring future recommendation is better than focusing on past behavior is A−.
NPS predicts likelihood to discourage (C)
Does being less likely to recommend mean that people will discourage others? There isn’t much research published on the relationship between likelihood to recommend and active discouragement as opposed to simply being unwilling to recommend. In our analysis of the likelihood of 324 social media users to recommend and their likelihood to discourage the use of social media platforms, we found likelihood to recommend predicts about 30% of likelihood to discourage. That is significant, but it leaves about two-thirds to three-fourths of the variation in likelihood to discourage unaccounted for. This suggests that NOT recommending is not a strong substitute for measuring intent to recommend against or discourage others from a brand. If researchers can get ratings of only one behavioral intention in contexts where recommendation is a plausible user behavior, it should be LTR. For a clearer picture of the full range of behavioral intention, there appears to be value in also collecting ratings of likelihood to discourage. This doesn’t fail the claim because if you want to stick with just one item (LTR), our analysis suggests you still get a good, albeit imperfect, read on discouragement.
Our grade for the claim that the NPS predicts likelihood to discourage is C.
NPS should always be used (D)
The NPS is very popular, and some of its proponents push for its near-universal use. Yet even in Reichheld’s original HBR article, despite the claim in the title “The One Number You Need to Grow,” he reported that LTR was best for most but not all companies, ranking first or second in 11 out of 14 case studies. In our experience, LTR works well only when the product or service can reasonably be recommended. For example, it can seem unreasonable to ask employees to use LTR to rate enterprise software they must use for, say, booking travel or doing expense accounting. In our experience, employees asked to rate their likelihood of recommending these types of products either balk at the request or treat the LTR as if it were a satisfaction rating. They can do it, but it’s not ideal.
This claim doesn’t completely fail because even in cases where the NPS is used inappropriately, it often correlates highly with other, more appropriate measures of satisfaction and loyalty. Often, having the same common measure, even an imperfect one, can keep dialogue going when departments speak different languages. While the word “OK” isn’t always the best way to express yourself around the world, it’s almost always understood.
Our grade for the claim that the NPS should always be used is D.
NPS should never be used (F)
Based on our analysis of the other claims, it does not seem reasonable to say that the NPS should never be used, though there are some who assert this. The NPS has its weaknesses, but it has considerable strength when used properly (e.g., together with open-ended questions to get details about the “why” of the rating) in the proper context.
There can be legitimate concerns about Campbell’s Law (also known as Goodhart’s Law)—that using metrics like the NPS for high-stakes incentives can lead to corruption of the process, which then leads to the Sauro and Lewis corollary, mismanagement leads to mismeasurement. The solution to this problem isn’t to drop the NPS, as any metric that replaces it will become subject to Campbell’s Law. Better approaches are to use other metrics (e.g., actual sales) for incentives or to increase governance to reduce corruption and the resulting distortion of the measurements.
Our grade for the claim that the NPS should never be used is F.
NPS has no value because it doesn’t tell you what to fix (F)
This claim is more of a misconception or misunderstanding about the value and purpose of measures like the NPS. The criticism voiced by a few notable UX figures is that a measure should tell you what to do. And worse, if they don’t, they’re flawed or have no practical value. Following this argument, the NPS is not diagnostic; therefore, it has no value. We disagree.
Throwing out measures because they don’t tell you what to do means throwing out most measures in most situations. From the NPS and satisfaction to temperature and weight, as well as completion rates and SUS scores, many measures aren’t diagnostic.
But it’s unrealistic to expect a high-level measure to dictate a specific course of action (e.g., “Do we lower prices,” “Should we invest in that new feature,” “What color button do I use,” or “Do we change the top navigation labels”). While some standardized UX questionnaires can help narrow your focus, it’s a stretch to expect them to tell you exactly what to fix.
For example, the SUPR-Q® has items on ease/navigation, trust, and appearance. Scoring lower on these attributes narrows the focus but won’t tell you exactly what’s causing it. Likewise, the UX-Lite™ has items that assess usefulness and usability. Scoring low on usefulness, for example, narrows in on functionality more than usability, but it doesn’t tell you what’s not useful. This is why leading practice in using the NPS is to include an open-ended question in which respondents can explain their rating. This combination is powerful because tracking the NPS over time enables detection of unexpected declines in the high-level measurement, while the open-ended question provides context and corrective direction.
It’s not choosing between a measure or an observation; it’s choosing the right measures for your observations. This claim has a serious logical flaw because it’s a bit like saying thermometers have no measurement value because they don’t tell you how to react to a fever (e.g., ice bath, pain reliever, antibiotics, some combination of treatments).
Our grade for the claim that the NPS has no value because it doesn’t tell you what to fix is F.
Summary and Report Card
Figure 4 shows the final report card for these claims about the NPS.
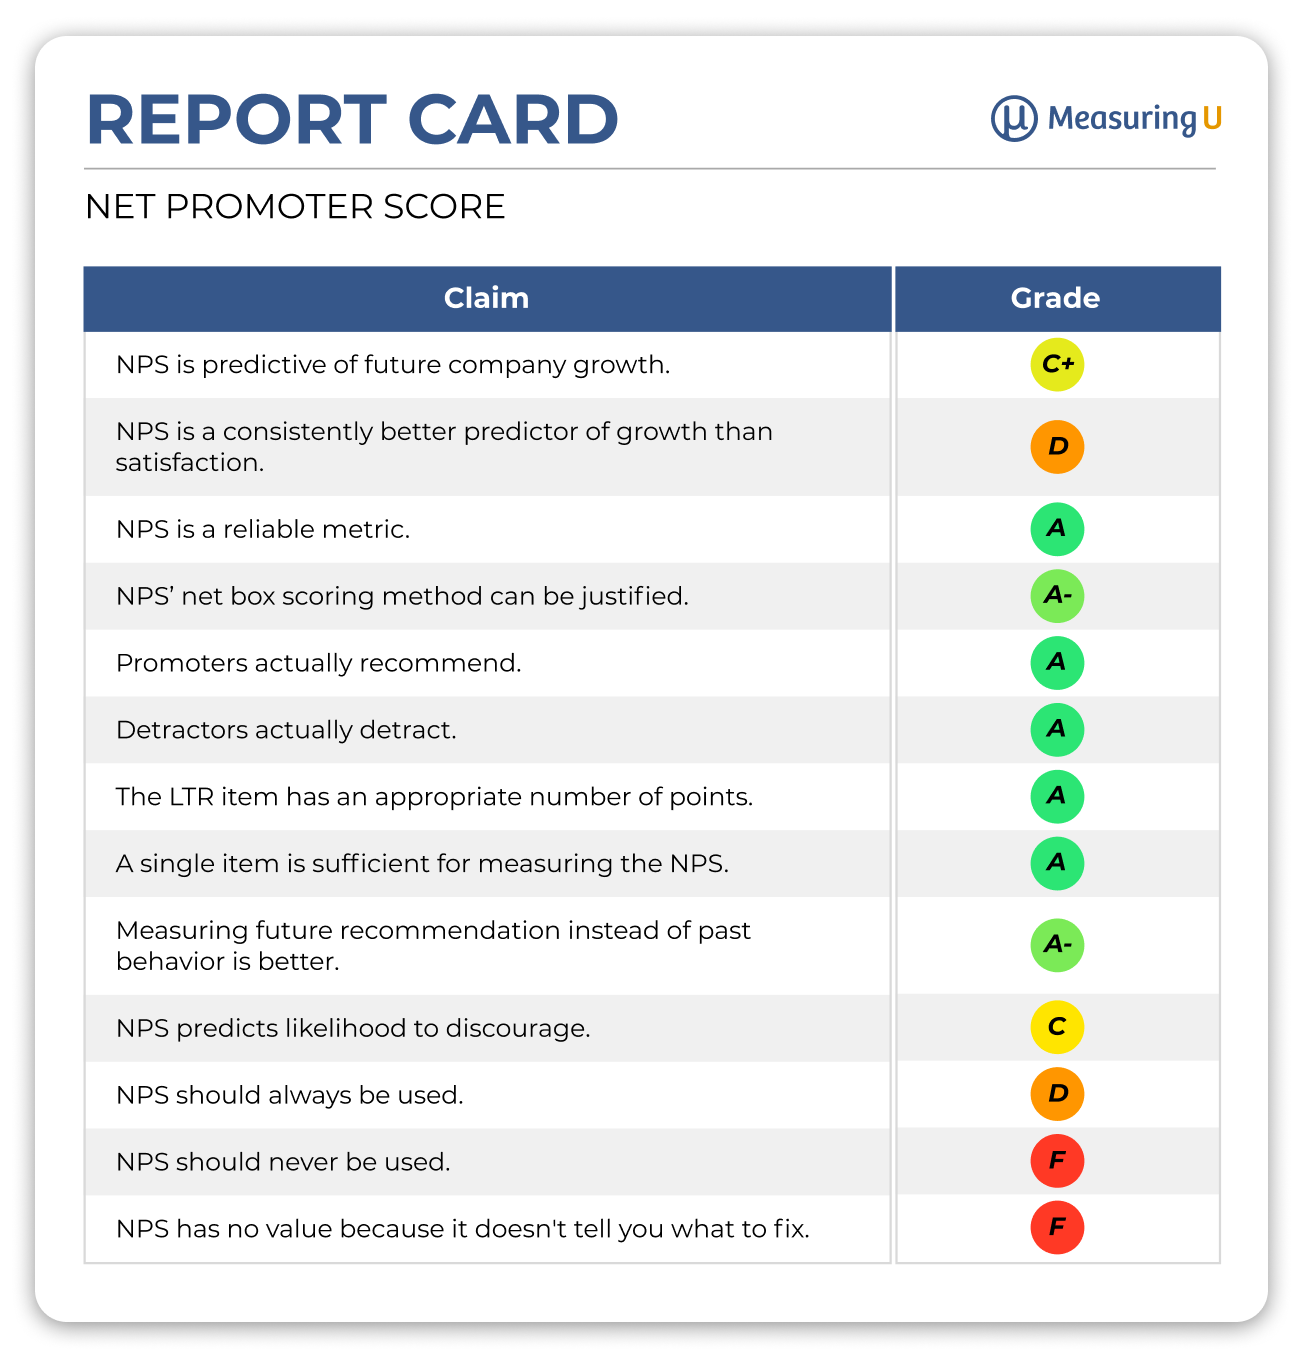
Figure 4: The NPS claims report card.
Our review of these claims and the evidence for and against them somewhat favors the ability of the NPS to predict growth, but it’s not consistently better than more traditional measures of satisfaction. It is also partially predictive of discouragement, but not well enough to substitute for specific discouragement metrics when carefully measuring intention to discourage is important.
On the more positive side, the NPS is a reliable metric and, despite seeming “wacky” to some critics, Reichheld’s box scoring produces a reasonable partitioning of LTR responses into the three NPS categories (detractor, passive, promoter) with evidence that promoters actually promote and detractors actually detract. The single LTR item is sufficient to measure recommendation likelihood, the eleven-point scale works well in practice to identify extreme responders, and future recommendation works a little better than past behavior when predicting future recommendation behavior.
Regarding when the NPS should be used, neither of the extreme claims (always use it or never use it) is warranted. The decision about whether to implement the NPS in a company depends on whether it’s possible for their product or service to reasonably be recommended. Companies that already use the NPS should probably continue to do so, while companies that use a standard satisfaction metric should probably continue to do that.