Five Styles of Statistical Rhetoric
When learning statistics, you’ll encounter many formulas based on principles of probability and mathematics. But statistics isn’t just a formulaic process where you enter data and are told what to do. Statistics should guide, not dictate, decisions. In making decisions, though, there are different styles of interpreting data. Although a lot of people think statistics

UX and Net Promoter Benchmarks of Seller Marketplace Websites
When we think of how the internet has changed commerce, we often consider our ability to browse and purchase products from around the world easily from the comfort of our homes with our mobile phones. But the internet has also enabled millions of people to easily sell their products to global consumers. That selling often
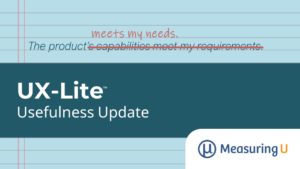
UX-Lite Usefulness Update
Can an experience be useful without meeting your needs? The UX-Lite™ is a new questionnaire that evolved from the SUS and the UMUX-Lite. It has only two items, one measuring perceived Ease and one measuring perceived Usefulness, as shown in Figure 1. Because the verbal complexity of the original Usefulness item stands in stark contrast

Measuring Tech Savviness
What is tech savviness? While it might be hard to define, you probably know someone whom you consider tech savvy—they might even be your go-to person for solving tech issues. Or maybe you know people who aren’t tech savvy and struggle with all technology. But why should UX researchers care? The concept of tech savviness
Sample Sizes for a SUS Score
Despite its age and the availability of other UX measures such as the UX-Lite™ and SUPR-Q®, the ten-item System Usability Scale (SUS) is still a very popular measure. It’s used widely in benchmark tests of software products to generate an overall score of perceived usability. We regularly collect SUS scores for dozens of consumer and
Completion Times and Preference for Sliders vs. Numeric Scales
In earlier articles, we investigated the effects of manipulating item formats on rating behaviors—specifically, we compared sliders to traditional five-point and eleven-point radio button numeric scales. For those analyses, we collected data from 212 respondents (U.S. panel agency, late January 2021) who used radio buttons and sliders to rate online shopping websites (e.g., Amazon) and
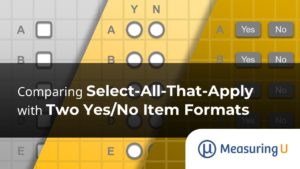
Comparing Select-All-That-Apply with Two Yes/No Item Formats
We conduct a lot of surveys and unmoderated studies at MeasuringU® using our MUIQ® platform. One of the first steps in these studies involves both screening (ensuring you have the right participants) and characterizing (having sufficient information for further analysis on the participants such as prior experience) the participants. While there are over a dozen

49 UX Metrics, Methods, and Measurement Articles from 2021
Happy New Year from all of us at MeasuringU®! In 2021 we posted 49 articles and welcomed several new clients to our UX testing platform MUIQ®, where we continue to add new features to reduce the friction in developing studies. We hosted our eighth UX Measurement Bootcamp, again as a virtual event. Going virtual still

Sliders versus Eleven-Point Numeric Scales on Desktop and Mobile Devices
Adding more points to a scale can increase its reliability and sensitivity. But more points also take up additional screen real-estate space. Imagine twenty or a hundred points displayed on desktop or, even worse, on mobile. One recent digital alternative, allowing for nuanced ratings using the same screen real-estate as a traditional scale, is the
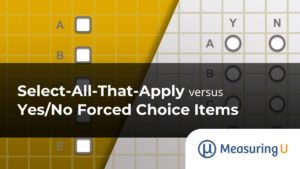
Select-All-That-Apply versus Yes/No Forced Choice Items
Do you have a Netflix subscription? Do you have a Hulu subscription? Which of the following services do you have a subscription to? Netflix Hulu Disney+ Peacock HBO Max Will you get a different percent of Netflix or Hulu selections if you ask the first form of the question compared to the second one? If

Sliders versus Five-Point Numeric Scales on Desktop and Mobile Devices
When it comes to collecting numeric ratings in online surveys, there is a definite allure to using sliders rather than the more common numeric scales with radio buttons. It just seems like you should get higher-quality measurements with sliders. Sliders give respondents many more response options, and they appear more engaging than multipoint scales. The

Censuses, Polls, Surveys, and Questionnaires:
How Are They Different?
Surveys are one of the most popular methods in applied research. While many have argued that surveys are overused, it’s hard to believe that surveys have no place in multi-method UX research. When conducting survey-based research, you’ll often encounter the terms census, poll, and questionnaire used in conjunction with—and often interchangeably with—the term survey. But